Your estate is leaving margin in the vineyard. You just can't see where yet.
vinwAIve is the AI intelligence layer for premium wine estates.
It connects the yield, operational and financial data you already generate and lets an AI analyst turn it into the insight management needs to act, before yield, margin or opportunity is lost.
vinwAIve is the AI intelligence layer for premium, multi-vineyard wine estates: section-level financials, live yield forecasting, pest and disease monitoring, what-if scenarios and wine product allocation in one powerful platform, with an AI analyst you can ask anything. Most software records the past. vinwAIve drives what happens next, turning the data you already own into yield, margin and ROI while there is still time to act.
Every vintage you make decisions with half the picture.
Spreadsheets, paper maps, scouting notes on someone's phone, end-of-year reports from your accountant. The data exists. It's just scattered across six different places, arriving too late to act on, and never telling you what's actually happening at the block level.
Your data exists. It just doesn't talk to itself.
Yield in a spreadsheet. Financials with your accountant. Disease pressure in a notebook. Every decision gets made from a partial picture built by hand. vinwAIve connects all of it.
By the time you know, it's already too late.
Your vintage report lands six weeks after harvest. The decisions for next season are already in motion. vinwAIve gives you the same picture in-season, while there's still time to act.
Your estate average is hiding your worst block.
A reasonable headline number can mask a 50-point GP spread between your best and worst sections. Estate averages don't reveal problems. They bury them.
Not a dashboard. An intelligence layer that thinks for your estate.
Most vineyard software is a rear-view mirror. vinwAIve is built so every section, every scouting note, every variety and every dollar feeds an intelligence platform designed to surface what matters while there's still time to act on it.
Predictive intelligence
Ask what this vintage will deliver in revenue, yield and margin before it does. vinwAIve models forward outcomes at the section level, not estate averages.
Preventative insight
Traffic-light rankings show which sections are drifting off yield or cost targets while there's still time to act. Flagged in-season, not six weeks after vintage.
Conversational AI
Ask anything. Which blocks should I prioritise? What's driving my Chardonnay margin gap? Where do I have a SKU deficit? Get answers, not just data.
One platform. Every seat at the table sees their own question answered.
Wine businesses buy and run by committee. vinwAIve gives each decision-maker the view that matters to them, drawn from the same connected estate data, so the whole team is working from one version of the truth.
"Where are we making and losing money across the estate?"
Portfolio-level revenue, gross profit and risk in one view, with the ability to drill from estate to block in seconds.
"Where are the hot spots across the business right now, from vineyard to sales and finance?"
Traffic-light rankings of every section against yield and cost targets, so the week's priorities set themselves.
"Where are yield, disease and operational risks emerging?"
Scouting, field notes, fruit maturity and weather in one feed, each tied to the section, tonnage and margin it affects.
"Do we have the right fruit, quality and volume for our wine programme?"
Supply versus demand by SKU, section-to-label traceability and maturity data, without touching cost reports.
"Where are costs and margin deviating from plan?"
Cost per tonne, revenue per hectare and GP% by section and label, target versus actual, updated through the season.
"Are we on track, where is the business exposed, and where are the opportunities?"
A clear read on vintage trajectory, supply risk, margin drivers and emerging opportunities, with read-only access for directors and advisors.
Role-based permissions built in: a vineyard manager can see block and scouting data without company financials, a winemaker can see allocations without cost reports, and consultants or directors get read-only access. The account admin controls who sees what.
You won't just see more. You'll decide better.
- Which sections need intervention now, and which to leave alone?
- Where are we likely to miss our yield or margin target?
- Which vineyards are driving, or destroying, profitability?
- Where will we have fruit surpluses or shortages by SKU?
- Which blocks deserve another dollar of investment, and which to re-evaluate?
- What happens to profit if yield, price or quality changes?
See problems before, not during, vintage
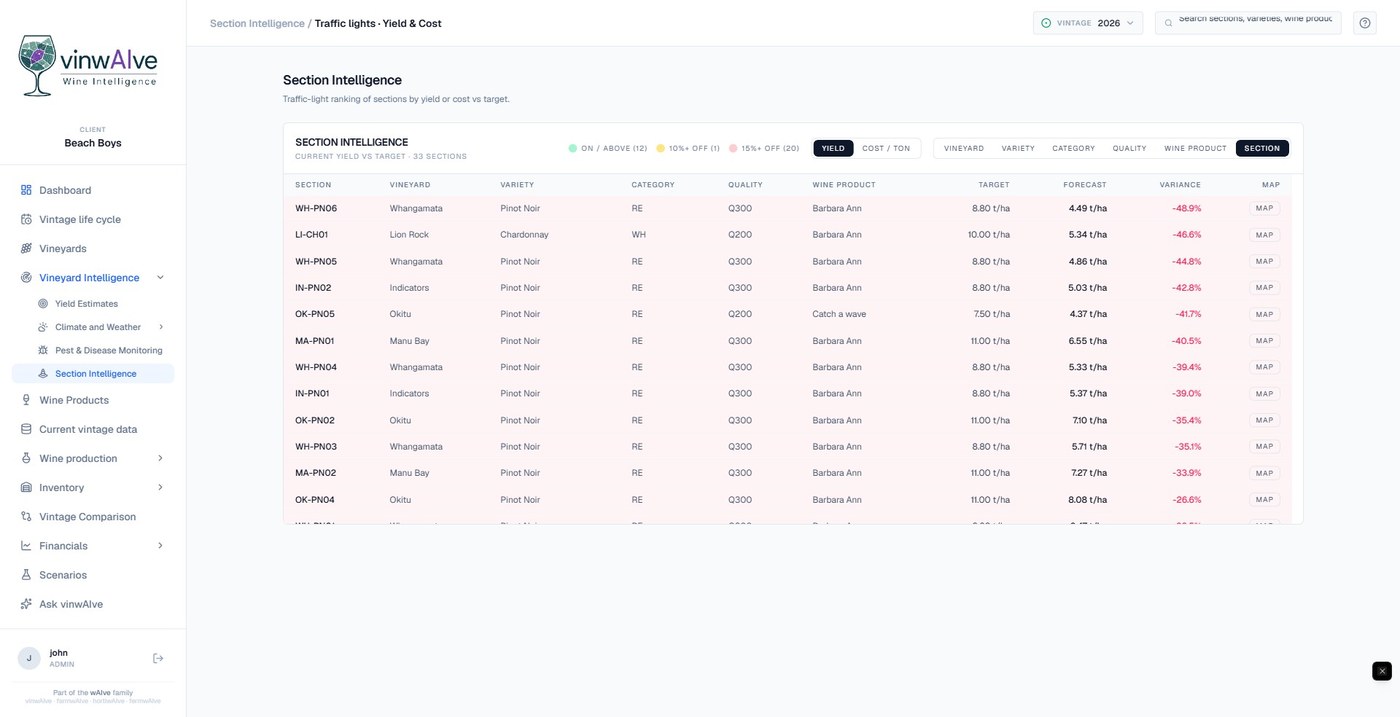
Section Intelligence ranks every block with a traffic light against its yield and cost targets: on track, 10% off, 15% or more off. When a section starts drifting, you see it with weeks to act, mapped and ranked by impact.
→ Traffic-light ranking of every section, live all vintage
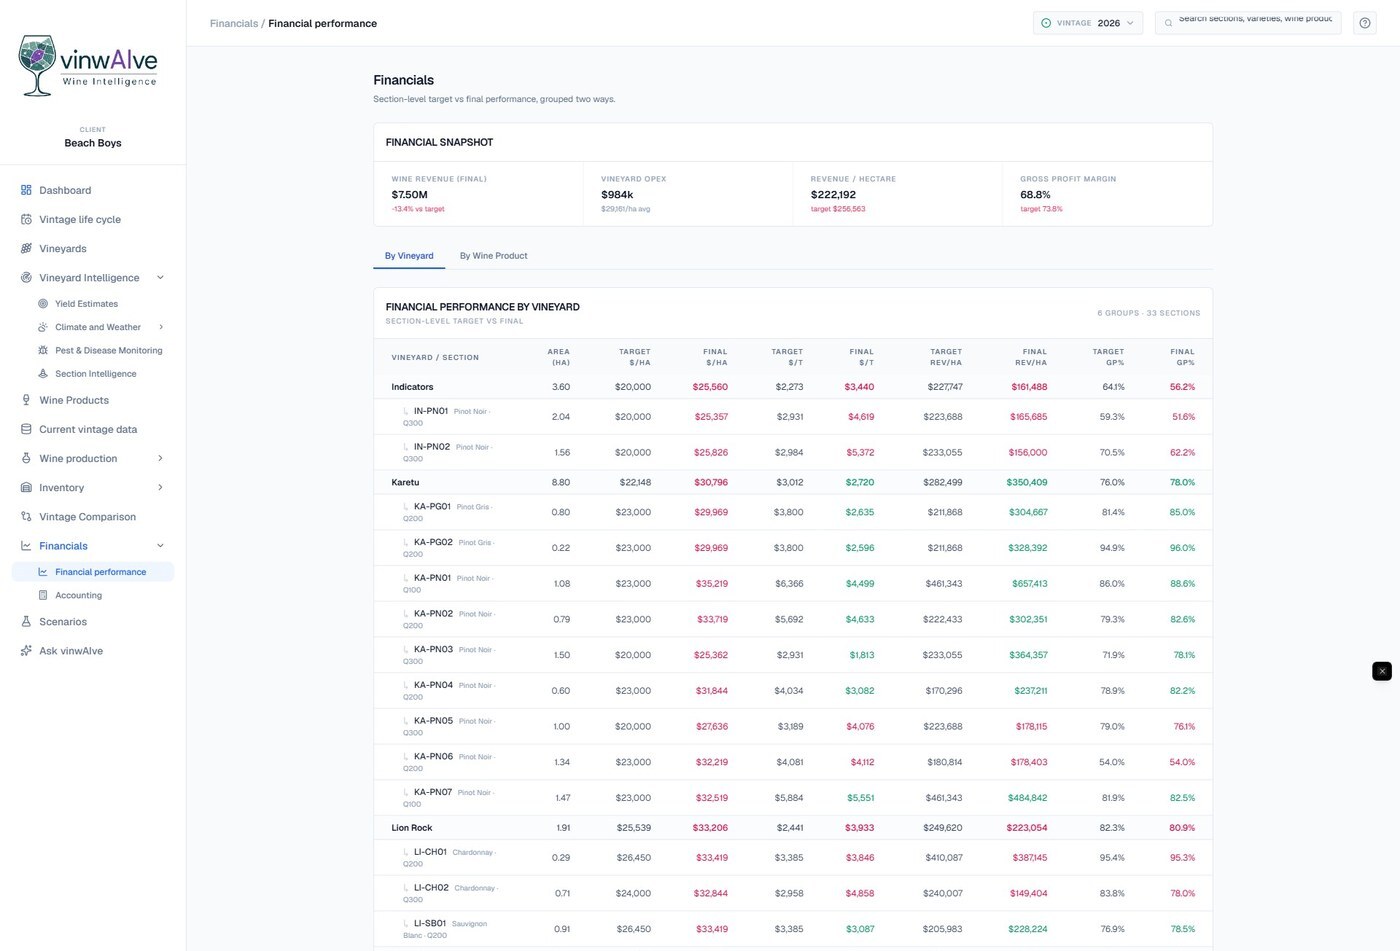
Your section P&L in-season, not six weeks after vintage
Revenue per hectare, gross profit margin and cost per tonne at the block level, target versus actual, updated throughout the season. Not a blended estate number. The actual performance of every section, while it still affects your decisions.
→ $/ha, $/tonne and GP% by section, all vintage long
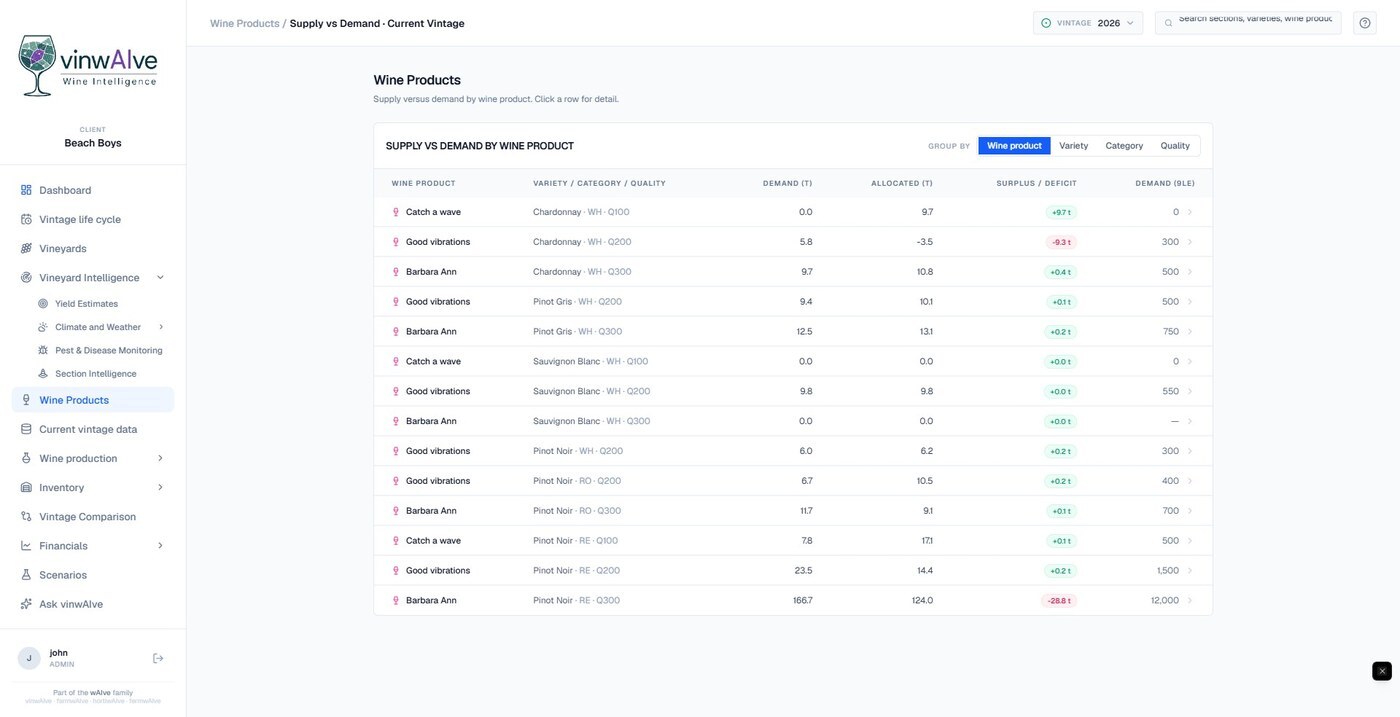
Which wine products are actually making you money
Trace every block to the label it feeds. See supply versus demand by SKU in tonnes and 9-litre case equivalents, surplus and deficit flagged per product. Make allocation, replanting and pricing decisions from actual margin data instead of assumptions.
→ Vine to bottle, margin connected
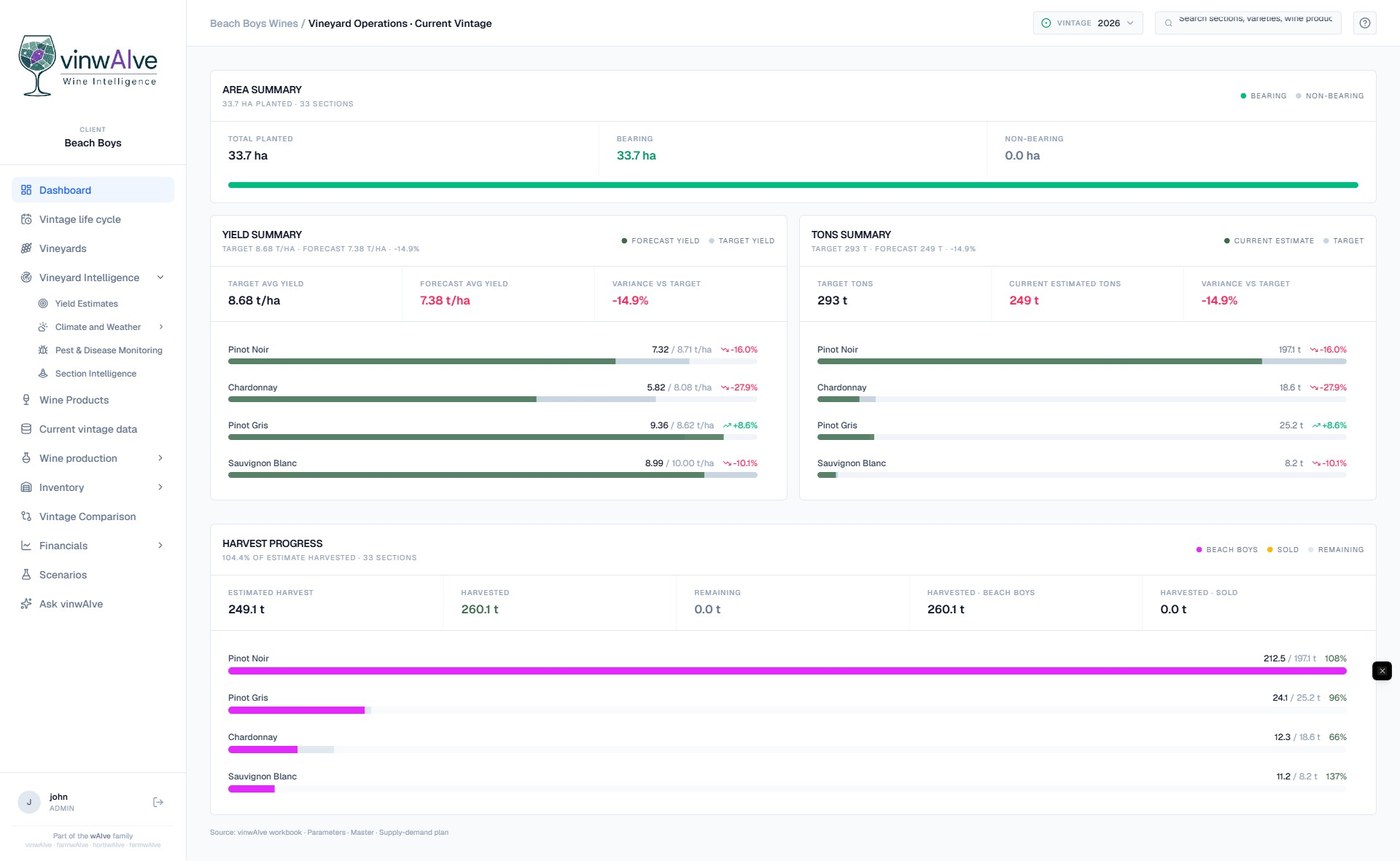
Yield forecasts that stay current without the rebuild
Field-scored yield samples per section, by growth stage, rolled up live across the estate. Supply commitments, winery schedules and harvest logistics run on current data rather than last year's actuals and a gut feel. Harvest progress tracks fruit kept versus sold against the estimate as it comes in.
→ Per-section forecasts and harvest tracking, updated throughout vintage
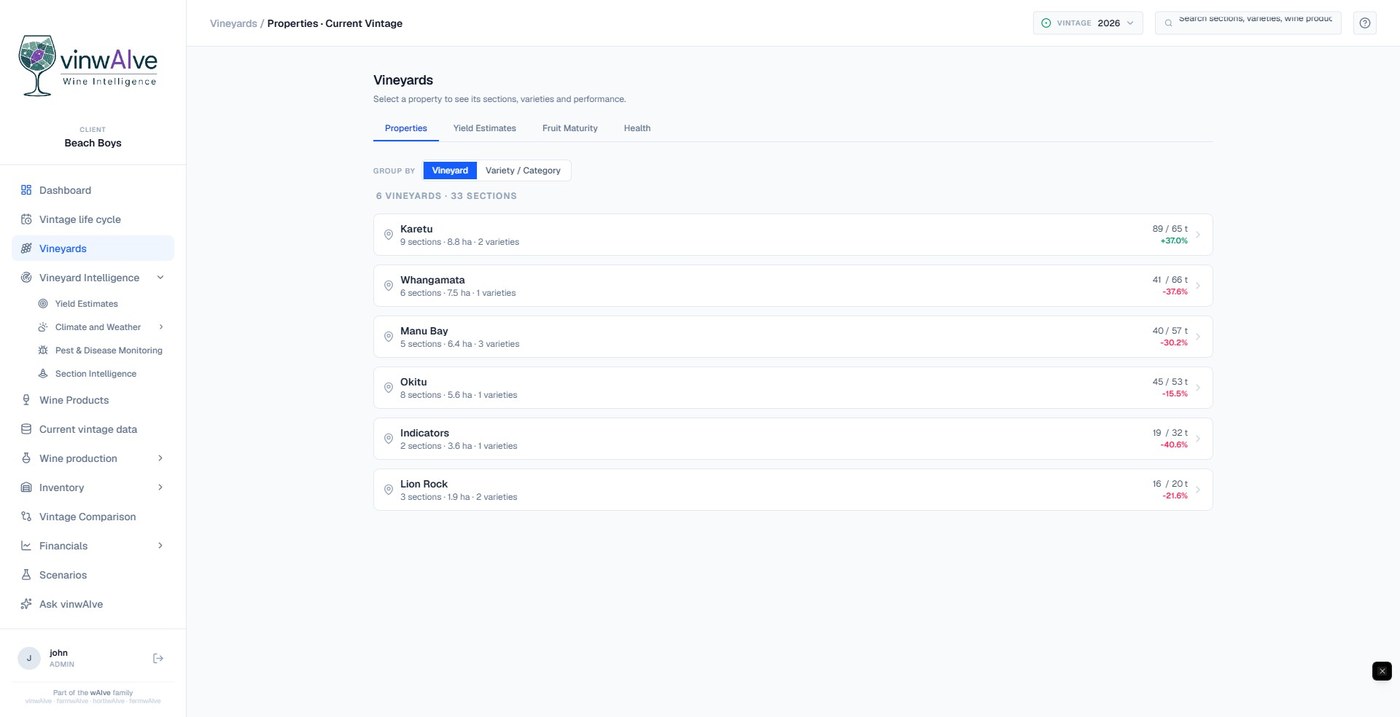
Every property and section, side by side
Running more than one property? vinwAIve gives you one view across all vineyards with section-level detail on demand: group by property, variety, category or quality tier and compare side by side.
→ Any property, any section, side by side
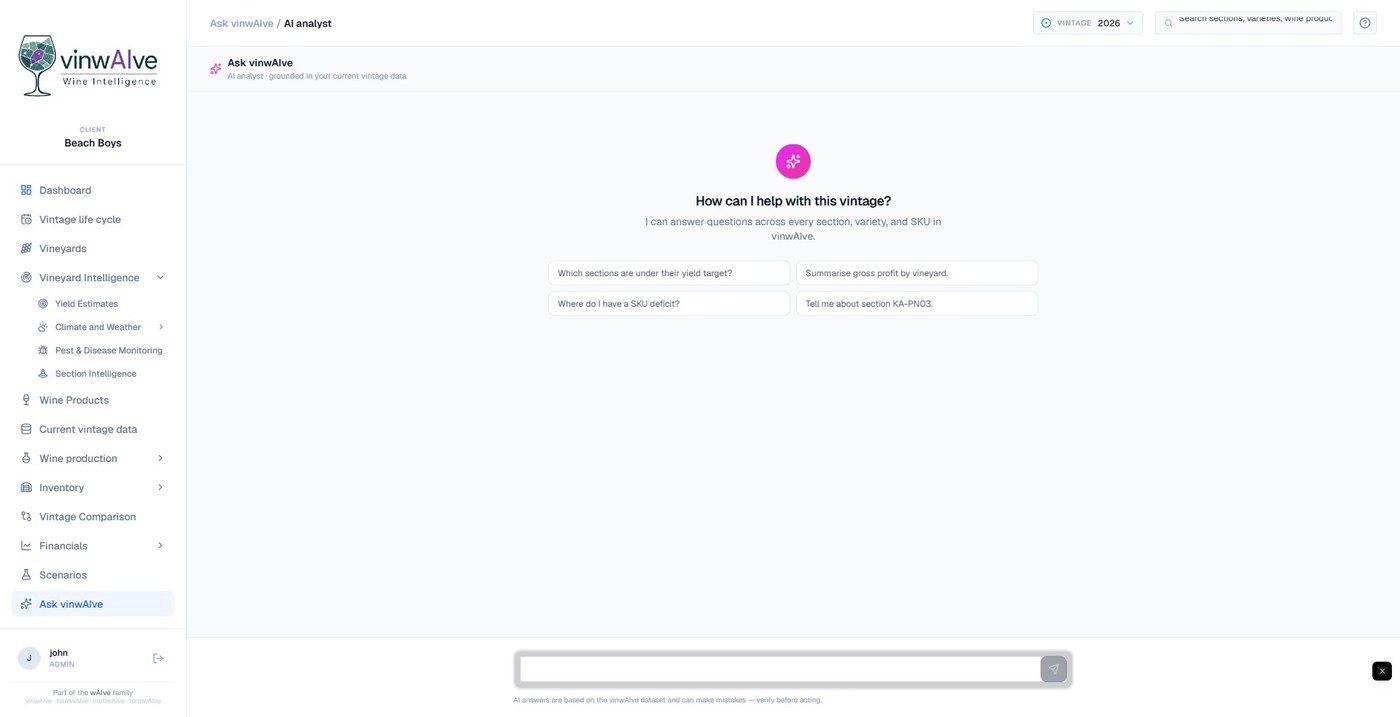
Ask your estate anything. Get an answer in seconds.
Which sections are under yield target? Where do I have a SKU deficit? Tell me about section KA-PN03. Plain-language answers grounded in your actual estate data. No pivot tables. No three-hour rebuild.
→ Natural language across your full estate dataset
What's happening in the rows, not just the ledger.
vinwAIve now runs your vineyard operations alongside your financials, so scouting, field notes, maturity and weather live in the same platform as your margins, and the AI reasons across all of it.
Pest & disease monitoring
Structured scouting observations across diseases, pests, beneficial insects and disorders. Filter by vineyard, variety, quality tier or section, with a draft-and-post workflow your whole team can use from the field.
Field observations
A live feed of notes posted from the vineyard, each tagged Good, Concern or Alert and tied to a section. Tap a section code and the full detail, history and financials open alongside it.
Fruit maturity
Per-section maturity sampling tracked through the ripening curve, sitting next to the same section's yield estimate and P&L, so picking decisions balance flavour, tonnage and margin.
Weather & climate
Live weather station feeds per property, district forecasts and seasonal data embedded in the platform. Soil moisture and irrigation integrations are on the roadmap next.
Section intelligence
Every observation, sample and dollar rolls up into a traffic-light ranking of your sections by yield and cost versus target, so the day's priorities set themselves.
One brain across it all
Because operations and financials share one platform, the AI can connect a disease flag to a yield risk to a margin impact on the label that block feeds.
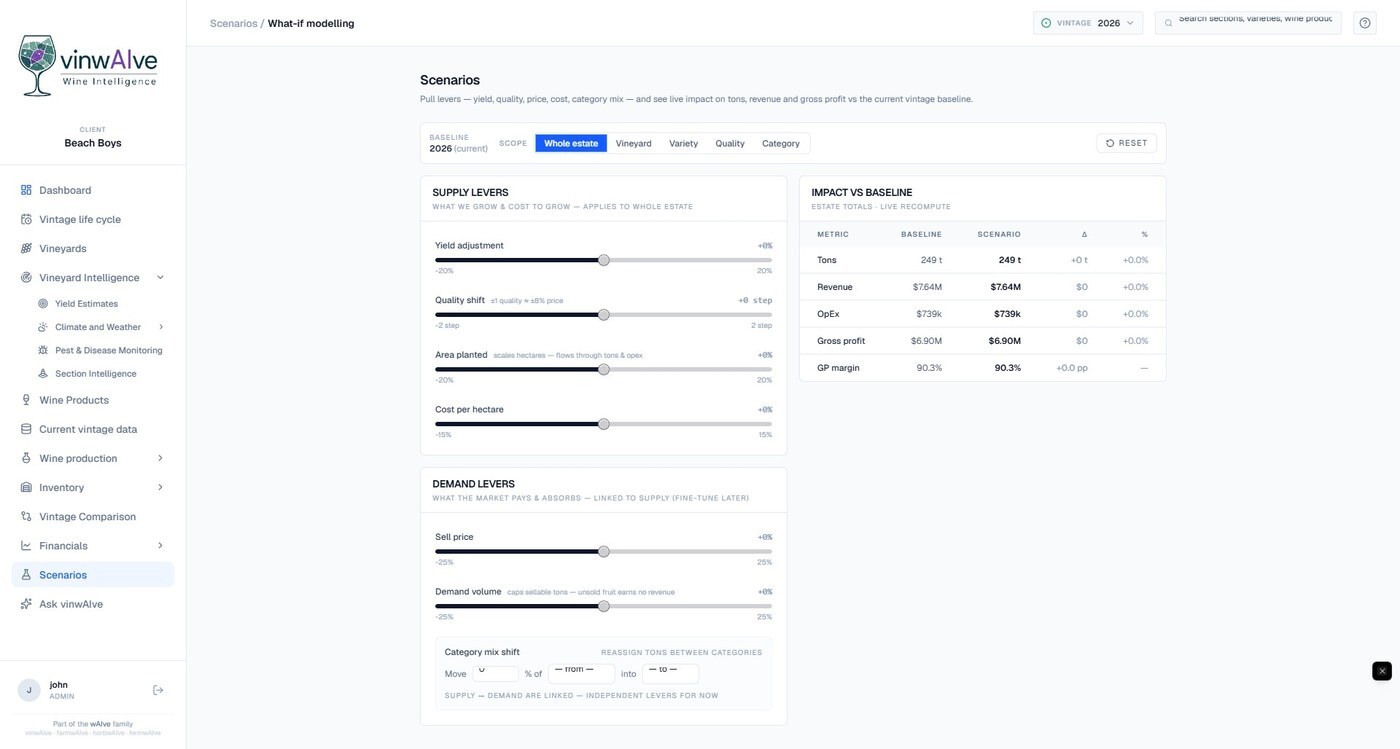
Know the financial consequence before you make the decision
What happens to gross profit if yield drops 10%? If you shift a block up a quality tier? If the market pays 5% less? Scenarios lets you pull supply and demand levers and watch the impact on tonnes, revenue, OpEx and GP recompute live against your current vintage baseline.
→ Supply and demand levers, live GP impact vs your baseline
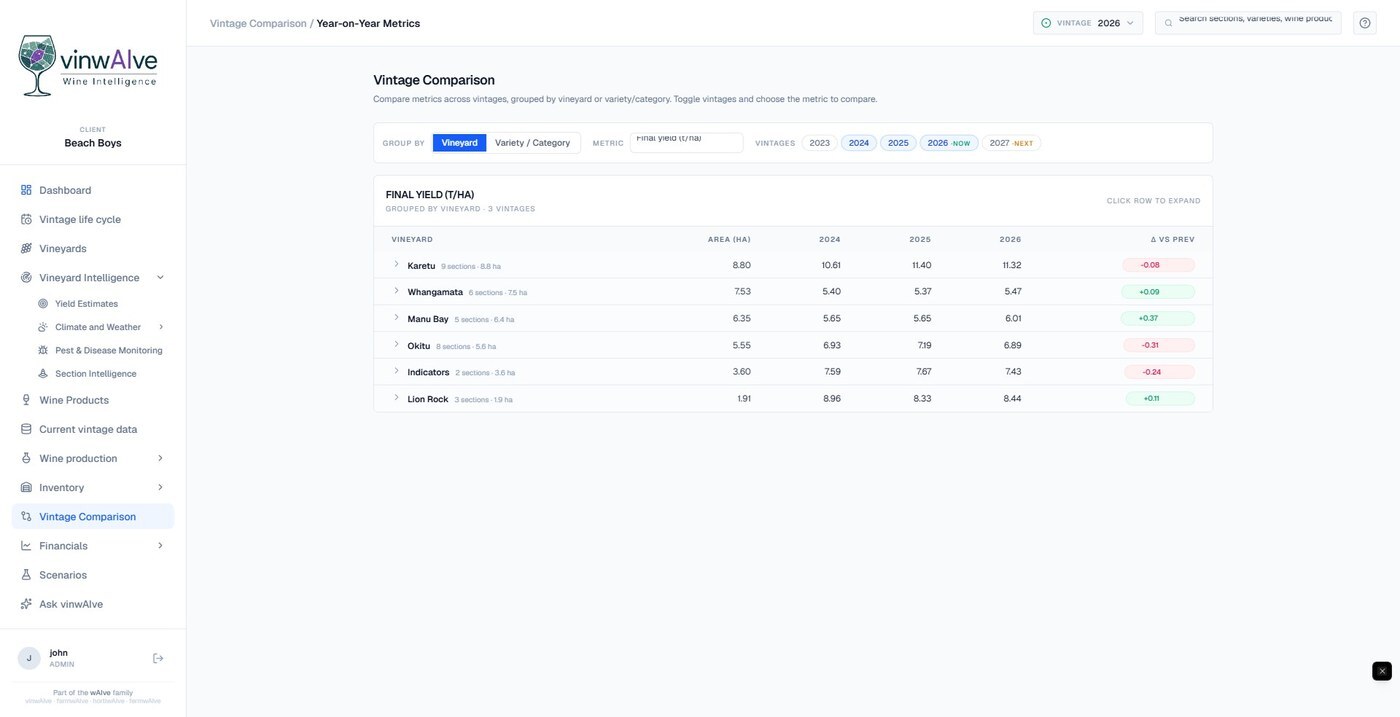
Run this vintage. Plan the next. Benchmark the last three.
vinwAIve manages the whole vintage life cycle: move the current vintage through its stages, close it off with a clean audit trail, and promote the next one, while Vintage Comparison puts year-on-year yield, tonnes and targets side by side. Every target you set is benchmarked against what the same section actually delivered before, so next season's plan is built on evidence rather than optimism.
→ Vintage life cycle, year-on-year comparison, targets with memory
Not a chatbot bolted on. An analyst that reasons across your entire estate.
This is what changes the game. vinwAIve's AI connects yield, operations, cost, allocation and financial performance into one live model of your estate, then reasons across all of it. The questions that used to take an analyst three days and a stack of spreadsheets now take one sentence and a few seconds.
"Which sections are under their yield target right now, and which are at risk of missing their GP?"
"Where do I have a supply deficit against demand, and which wine products are most exposed?"
"Summarise gross profit by vineyard and tell me which property is dragging down my estate margin."
"Which sections are dragging down my reserve label's blended GP? What happens if I move the weakest one out?"
"Show me every Alert observation from the last fortnight and the yield trend in those sections."
"Based on this vintage, which sections should I increase investment in next year, and which should I re-evaluate?"
Customisable to your business. Do not adjust your reporting to fit the constraints of traditional databases. Ask vinwAIve to report on the aspects that matter most to you.
Adopting something new should lower your risk, not add to it.
vinwAIve is designed to prove its value on your own data, and to sit over the systems you already trust rather than replace them.
Prove it on your own data
See exactly what section-level visibility looks like for your operation, walked through with your own yield and financial data, before any commitment.
No rip and replace
vinwAIve links your production, accounting, compliance and warehouse systems, and imports your spreadsheets. The intelligence layer sits over the top of what you already run.
Live in one onboarding session
No IT project and no data migration. We map your estate structure and connect your systems, so most estates are up and running within a single session.
vinwAIve sits at the centre of the systems you already run.
No rip and replace. vinwAIve links the production, accounting, compliance and warehouse systems your estate already uses, and imports your existing spreadsheets, so the intelligence layer sits over the top of everything.
Every number your estate generates. Finally connected.
Financial Performance
- Total wine revenue vs target
- Vineyard OpEx and cost per hectare
- Revenue per hectare by section and vineyard
- Gross profit margin %, section and estate level
- Cost per tonne: target vs actual variance
- GP% trajectory in-season vs end-of-vintage
Yield Intelligence
- Total estate yield: target vs current forecast
- Field-scored samples per section, by growth stage
- Variety-level yield breakdown
- Tonnes per hectare: target vs forecast vs final
- Harvest progress: kept vs sold, live
- Historical yield benchmarking by block
Operations Intelligence
- Pest and disease scouting observations
- Field notes: Good / Concern / Alert by section
- Fruit maturity sampling per section
- Live weather stations and district forecasts
- Traffic-light section rankings, yield and cost
- Seasonal and regional viticulture data
Wine Product & Allocation
- Section-to-wine-label allocation mapping
- GP% and revenue per hectare by wine product
- Supply vs demand by SKU: tonnes and 9LE cases
- Surplus and deficit flagged per product
- Multi-product contribution to estate GP
- Category and quality-tier roll-ups
Scenario & Vintage Planning
- What-if levers: yield, quality, price, cost, mix
- Live GP impact vs current vintage baseline
- Year-on-year vintage comparison
- Vintage life cycle: stage, close-off, promote
- Next-vintage targets built on actuals
- Rolling variance summary across the estate
AI-Powered Insights
- Traffic-light flags: sections drifting off target
- Predictive vintage revenue and margin forecasts
- Root-cause analysis for every variance
- Outperformer identification
- Allocation recommendations from live data
- Natural language Q&A across the full estate
Still running on spreadsheets and a six-week-old vintage report?
| Capability | vinwAIve | Spreadsheets | Generic farm software | Legacy vineyard tools |
|---|---|---|---|---|
| Section-level financial performance | Yes, live | Manual, error-prone | Not available | Partial / end of season |
| Traffic-light target vs actual tracking | Yes, in-season | Manual updates only | Sometimes | Sometimes |
| Pest & disease scouting with financial context | Yes | No | Scouting only | Scouting only |
| What-if scenario modelling on GP | Yes, live recompute | No | No | No |
| Year-on-year vintage comparison | Yes | With effort | No | Varies |
| Wine product to section traceability | Yes | No | No | Rarely |
| GP% by block, by wine label | Yes | No | No | No |
| Predictive vintage revenue forecasting | Yes | No | No | No |
| AI natural language querying | Yes | No | No | No |
| Weather & climate feeds per property | Yes | No | Sometimes | Varies |
| Multi-vineyard portfolio view | Yes | With effort | Sometimes | Varies |
| Built specifically for premium wine estates | Yes | Generic | Generic | Sometimes |
Your data is already there. We connect to it.
No IT project. No data migration. No starting from scratch. vinwAIve links the systems your estate already runs and imports the data it already produces, and gets you up and running within a single onboarding session.
Spreadsheet import
Upload your existing yield workbooks, section data and financial records. vinwAIve parses them automatically, no reformatting required. Most estates are up and running within a single onboarding session.
System connections
Link your production database, accounting software, compliance portals and warehouse systems so everything your team needs sits behind one login, with data imports keeping the picture current through the season.
Guided onboarding
You do not need an IT team. Our onboarding maps your estate structure, sections, varieties and wine products into the platform. We do the setup. You get the visibility, usually within the first session.
Everything you need to know
What is vinwAIve?
Who is vinwAIve built for?
How is vinwAIve different from other vineyard management software?
What does the pest and disease monitoring do?
What is scenario modelling in vinwAIve?
Can vinwAIve compare vintages?
What data does vinwAIve connect and analyse?
Can vinwAIve manage multiple vineyards?
How does the AI work in vinwAIve?
What is section-level vineyard analytics?
We already use a winery production system. Does vinwAIve replace it?
Does vinwAIve include weather data?
What if our data is messy or incomplete?
Is our vineyard data secure and private?
Can we control who has access to what data inside the platform?
See where your estate is leaving margin in the vineyard.
Walk through the platform with your own estate data and see exactly what section-level visibility looks like for your operation, before the next vintage is already in motion.
Votre domaine laisse de la marge dans le vignoble. Vous ne voyez simplement pas encore où.
vinwAIve est la couche d'intelligence IA des domaines viticoles premium. Elle relie les données de rendement, d'exploitation et financières que vous générez déjà et laisse un analyste IA les transformer en insights dont la direction a besoin pour agir, avant que rendement, marge ou opportunité ne soient perdus.
Qu'est-ce que vinwAIve ? vinwAIve est la couche d'intelligence IA des domaines viticoles premium multi-vignobles : finances par parcelle, prévision des rendements en direct, suivi des maladies et ravageurs, scénarios de simulation et allocation des produits dans une seule plateforme puissante, avec un analyste IA à qui tout demander. La plupart des logiciels enregistrent le passé. vinwAIve pilote la décision suivante et transforme les données que vous possédez déjà en rendement, en marge et en ROI, pendant qu'il est encore temps d'agir.
Chaque millésime, vous décidez avec la moitié du tableau.
Des tableurs, des cartes papier, des notes de terrain sur le téléphone de quelqu'un, des rapports de fin d'année de votre comptable. Les données existent. Elles sont simplement dispersées dans six endroits différents, arrivent trop tard pour agir et ne vous disent jamais ce qui se passe réellement au niveau de la parcelle.
Vos données existent. Elles ne se parlent simplement pas.
Le rendement dans un tableur. Les finances chez votre comptable. La pression des maladies dans un carnet. Chaque décision se prend sur une image partielle reconstituée à la main. vinwAIve relie tout.
Quand vous le savez, il est déjà trop tard.
Votre rapport de millésime arrive six semaines après les vendanges. Les décisions de la saison suivante sont déjà en marche. vinwAIve vous donne la même image en cours de saison, quand il est encore temps d'agir.
La moyenne de votre domaine cache votre pire parcelle.
Un chiffre global correct peut masquer un écart de 50 points de marge brute entre vos meilleures et vos pires parcelles. Les moyennes de domaine ne révèlent pas les problèmes. Elles les enterrent.
Pas un tableau de bord. Une couche d'intelligence qui pense pour votre domaine.
La plupart des logiciels viticoles sont des rétroviseurs. vinwAIve est conçu pour que chaque parcelle, chaque note de terrain, chaque cépage et chaque euro alimentent une plateforme d'intelligence pensée pour faire remonter l'essentiel pendant qu'il est encore temps d'agir.
Intelligence prédictive
Demandez ce que ce millésime livrera en chiffre d'affaires, en rendement et en marge avant qu'il ne le fasse. vinwAIve modélise les résultats à venir au niveau de la parcelle, pas des moyennes de domaine.
Insight préventif
Des classements en feux tricolores montrent quelles parcelles dérivent de leurs objectifs de rendement ou de coûts pendant qu'il est encore temps d'agir. Signalé en cours de saison, pas six semaines après le millésime.
IA conversationnelle
Posez toutes vos questions. Quelles parcelles prioriser ? Qu'est-ce qui creuse l'écart de marge sur mon Chardonnay ? Où ai-je un déficit par SKU ? Obtenez des réponses, pas seulement des données.
Une seule plateforme. Chaque personne autour de la table obtient une réponse à sa propre question.
Les entreprises du vin achètent et fonctionnent en collectif. vinwAIve donne à chaque décideur la vue qui compte pour lui, tirée des mêmes données connectées du domaine, pour que toute l'équipe travaille sur une seule version de la vérité.
« Où gagnons-nous et où perdons-nous de l'argent sur le domaine ? »
Chiffre d'affaires, marge brute et risques au niveau du portefeuille dans une seule vue, avec la possibilité de descendre du domaine à la parcelle en quelques secondes.
« Où sont les points chauds dans l'entreprise en ce moment, du vignoble aux ventes et à la finance ? »
Classements en feux tricolores de chaque parcelle par rapport aux objectifs de rendement et de coûts, pour que les priorités de la semaine s'imposent d'elles-mêmes.
« Où émergent les risques de rendement, de maladies et d'exploitation ? »
Surveillance, notes de terrain, maturité des raisins et météo dans un seul fil, chacun rattaché à la parcelle, au tonnage et à la marge qu'il affecte.
« Avons-nous les bons raisins, la bonne qualité et le bon volume pour notre programme de vins ? »
Offre et demande par SKU, traçabilité de la parcelle à l'étiquette et données de maturité, sans toucher aux rapports de coûts.
« Où les coûts et la marge s'écartent-ils du plan ? »
Coût par tonne, chiffre d'affaires par hectare et marge brute % par parcelle et par étiquette, objectif contre réalisé, actualisés tout au long de la saison.
« Sommes-nous sur la bonne trajectoire, où l'entreprise est-elle exposée et où sont les opportunités ? »
Une lecture claire de la trajectoire du millésime, du risque d'approvisionnement, des moteurs de marge et des opportunités émergentes, avec un accès en lecture seule pour les administrateurs et les conseillers.
Permissions par rôle intégrées : un chef de culture peut voir les données de parcelles et de surveillance sans les finances de l'entreprise, un maître de chai peut voir les allocations sans les rapports de coûts, et les consultants ou administrateurs disposent d'un accès en lecture seule. L'administrateur du compte contrôle qui voit quoi.
Vous ne verrez pas seulement plus. Vous déciderez mieux.
- Quelles parcelles nécessitent une intervention maintenant, et lesquelles laisser tranquilles ?
- Où risquons-nous de manquer notre objectif de rendement ou de marge ?
- Quels vignobles portent, ou détruisent, la rentabilité ?
- Où aurons-nous des excédents ou des déficits de raisins par SKU ?
- Quelles parcelles méritent un euro d'investissement de plus, et lesquelles réévaluer ?
- Que devient le profit si le rendement, le prix ou la qualité change ?
Voyez les problèmes avant le millésime, pas pendant
L'intelligence parcellaire classe chaque parcelle avec un feu tricolore par rapport à ses objectifs de rendement et de coûts : sur la trajectoire, 10 % d'écart, 15 % ou plus. Quand une parcelle commence à dériver, vous le voyez avec des semaines pour agir, cartographié et classé par impact.
→ Classement en feux tricolores de chaque parcelle, en direct tout le millésime
Votre compte de résultat par parcelle en cours de saison, pas six semaines après le millésime
Chiffre d'affaires par hectare, marge brute et coût par tonne au niveau de la parcelle, objectif contre réalisé, actualisés tout au long de la saison. Pas un chiffre de domaine lissé. La performance réelle de chaque parcelle, pendant qu'elle pèse encore sur vos décisions.
→ $/ha, $/tonne et marge brute % par parcelle, tout le millésime
Quels produits vinicoles vous rapportent vraiment de l'argent
Tracez chaque parcelle jusqu'à l'étiquette qu'elle alimente. Voyez l'offre et la demande par SKU en tonnes et en équivalents caisses de 9 litres, excédent et déficit signalés par produit. Prenez vos décisions d'allocation, de replantation et de prix à partir de données de marge réelles plutôt que d'hypothèses.
→ De la vigne à la bouteille, marge connectée
Des prévisions de rendement toujours à jour, sans tout reconstruire
Des échantillons de rendement relevés au champ par parcelle, par stade phénologique, consolidés en direct à l'échelle du domaine. Les engagements d'approvisionnement, les plannings de cave et la logistique des vendanges tournent sur des données actuelles plutôt que sur les chiffres de l'an dernier et une intuition. Le suivi des vendanges compare les raisins conservés et vendus à l'estimation au fil des apports.
→ Prévisions par parcelle et suivi des vendanges, actualisés tout au long du millésime
Chaque propriété et chaque parcelle, côte à côte
Vous exploitez plusieurs propriétés ? vinwAIve vous donne une vue unique sur tous les vignobles avec le détail par parcelle à la demande : regroupez par propriété, cépage, catégorie ou niveau de qualité et comparez côte à côte.
→ Chaque propriété, chaque parcelle, côte à côte
Demandez tout à votre domaine. Obtenez une réponse en quelques secondes.
Quelles parcelles sont sous leur objectif de rendement ? Où ai-je un déficit par SKU ? Parle-moi de la parcelle KA-PN03. Des réponses en langage courant, ancrées dans les données réelles de votre domaine. Pas de tableaux croisés dynamiques. Pas de reconstruction de trois heures.
→ Le langage naturel sur l'ensemble des données de votre domaine
Ce qui se passe dans les rangs, pas seulement dans les comptes.
vinwAIve pilote désormais vos opérations viticoles aux côtés de vos finances : surveillance, notes de terrain, maturité et météo vivent dans la même plateforme que vos marges, et l'IA raisonne sur l'ensemble.
Surveillance des ravageurs et des maladies
Des observations de surveillance structurées couvrant maladies, ravageurs, insectes auxiliaires et désordres physiologiques. Filtrez par vignoble, cépage, niveau de qualité ou parcelle, avec un flux brouillon puis publication que toute votre équipe peut utiliser depuis le terrain.
Observations de terrain
Un fil en direct de notes publiées depuis le vignoble, chacune étiquetée Bon, Vigilance ou Alerte et rattachée à une parcelle. Touchez un code de parcelle et le détail complet, l'historique et les finances s'ouvrent à côté.
Maturité des raisins
Un échantillonnage de maturité par parcelle suivi tout au long de la courbe de maturation, placé à côté de l'estimation de rendement et du compte de résultat de la même parcelle, pour que les décisions de récolte équilibrent arômes, tonnage et marge.
Météo et climat
Flux de stations météo en direct par propriété, prévisions régionales et données saisonnières intégrées à la plateforme. Les intégrations d'humidité du sol et d'irrigation sont les prochaines sur la feuille de route.
Intelligence parcellaire
Chaque observation, chaque échantillon et chaque euro remontent dans un classement en feux tricolores de vos parcelles selon le rendement et les coûts par rapport à l'objectif, pour que les priorités du jour s'imposent d'elles-mêmes.
Un seul cerveau sur l'ensemble
Parce que les opérations et les finances partagent une seule plateforme, l'IA peut relier un signalement de maladie à un risque de rendement et à un impact de marge sur l'étiquette que cette parcelle alimente.
Connaissez la conséquence financière avant de prendre la décision
Que devient la marge brute si le rendement baisse de 10 % ? Si vous montez une parcelle d'un niveau de qualité ? Si le marché paie 5 % de moins. Les scénarios vous permettent d'actionner les leviers d'offre et de demande et de voir l'impact sur les tonnes, le chiffre d'affaires, les charges d'exploitation et la marge brute se recalculer en direct par rapport à la base de votre millésime en cours.
→ Leviers d'offre et de demande, impact en direct sur la marge brute par rapport à votre base
Pilotez ce millésime. Planifiez le prochain. Comparez les trois derniers.
vinwAIve gère tout le cycle de vie du millésime : faites avancer le millésime en cours à travers ses étapes, clôturez-le avec une piste d'audit propre et promouvez le suivant, pendant que la comparaison des millésimes met côte à côte les rendements, les tonnes et les objectifs d'une année sur l'autre. Chaque objectif que vous fixez est comparé à ce que la même parcelle a réellement livré auparavant, pour que le plan de la saison suivante repose sur des preuves plutôt que sur de l'optimisme.
→ Cycle de vie du millésime, comparaison d'une année sur l'autre, des objectifs avec de la mémoire
Pas un chatbot greffé après coup. Un analyste qui raisonne sur tout votre domaine.
C'est ce qui change la donne. L'IA de vinwAIve relie rendement, opérations, coûts, allocation et performance financière dans un modèle vivant unique de votre domaine, puis raisonne sur l'ensemble. Les questions qui prenaient à un analyste trois jours et une pile de tableurs prennent désormais une phrase et quelques secondes.
« Quelles parcelles sont actuellement sous leur objectif de rendement, et lesquelles risquent de manquer leur marge brute ? »
« Où ai-je un déficit d'offre par rapport à la demande, et quels produits vinicoles sont les plus exposés ? »
« Résume la marge brute par vignoble et dis-moi quelle propriété tire vers le bas la marge de mon domaine. »
« Quelles parcelles pèsent sur la marge brute combinée de mon étiquette réserve ? Que se passe-t-il si je sors la plus faible ? »
« Montre-moi chaque observation en Alerte des deux dernières semaines et la tendance de rendement de ces parcelles. »
« Sur la base de ce millésime, dans quelles parcelles devrais-je investir davantage l'an prochain, et lesquelles réévaluer ? »
Personnalisable pour votre entreprise. N'adaptez pas votre reporting aux contraintes des bases de données traditionnelles. Demandez à vinwAIve de rapporter sur les aspects qui comptent le plus pour vous.
Adopter du nouveau devrait réduire votre risque, pas l'augmenter.
vinwAIve est conçu pour prouver sa valeur sur vos propres données et pour se poser au-dessus des systèmes auxquels vous faites déjà confiance plutôt que de les remplacer.
La preuve sur vos propres données
Voyez exactement à quoi ressemble la visibilité au niveau de la parcelle pour votre exploitation, présentée avec vos propres données de rendement et financières, avant tout engagement.
Rien à arracher ni à remplacer
vinwAIve relie vos systèmes de production, de comptabilité, de conformité et d'entrepôt, et importe vos tableurs. La couche d'intelligence se pose au-dessus de ce que vous exploitez déjà.
Opérationnel en une seule session d'intégration
Pas de projet informatique et pas de migration de données. Nous cartographions la structure de votre domaine et connectons vos systèmes : la plupart des domaines sont opérationnels en une seule session.
vinwAIve se place au centre des systèmes que vous exploitez déjà.
Rien à arracher ni à remplacer. vinwAIve relie les systèmes de production, de comptabilité, de conformité et d'entrepôt que votre domaine utilise déjà, et importe vos tableurs existants, pour que la couche d'intelligence se pose au-dessus de tout.
Chaque chiffre que votre domaine génère. Enfin connecté.
Performance financière
- Chiffre d'affaires vin total vs objectif
- Charges d'exploitation du vignoble et coût par hectare
- Chiffre d'affaires par hectare par parcelle et par vignoble
- Marge brute %, au niveau de la parcelle et du domaine
- Coût par tonne : écart objectif vs réalisé
- Trajectoire de la marge brute % en saison vs fin de millésime
Intelligence du rendement
- Rendement total du domaine : objectif vs prévision actuelle
- Échantillons relevés au champ par parcelle, par stade phénologique
- Détail des rendements par cépage
- Tonnes par hectare : objectif vs prévision vs final
- Avancement des vendanges : conservé vs vendu, en direct
- Historique des rendements par parcelle
Intelligence des opérations
- Observations de surveillance des ravageurs et maladies
- Notes de terrain : Bon / Vigilance / Alerte par parcelle
- Échantillonnage de maturité des raisins par parcelle
- Stations météo en direct et prévisions régionales
- Classements en feux tricolores des parcelles, rendement et coûts
- Données viticoles saisonnières et régionales
Produits vinicoles et allocation
- Cartographie de l'allocation parcelle vers étiquette
- Marge brute % et chiffre d'affaires par hectare par produit
- Offre vs demande par SKU : tonnes et caisses 9LE
- Excédent et déficit signalés par produit
- Contribution multi-produits à la marge brute du domaine
- Consolidations par catégorie et niveau de qualité
Scénarios et planification des millésimes
- Leviers prospectifs : rendement, qualité, prix, coûts, mix
- Impact en direct sur la marge brute vs la base du millésime en cours
- Comparaison des millésimes d'une année sur l'autre
- Cycle de vie du millésime : étape, clôture, promotion
- Objectifs du prochain millésime bâtis sur le réalisé
- Synthèse glissante des écarts sur tout le domaine
Insights pilotés par l'IA
- Feux tricolores : parcelles qui dérivent de l'objectif
- Prévisions prédictives de chiffre d'affaires et de marge du millésime
- Analyse des causes racines pour chaque écart
- Identification des surperformances
- Recommandations d'allocation à partir de données en direct
- Questions-réponses en langage naturel sur tout le domaine
Toujours sur des tableurs et un rapport de millésime vieux de six semaines ?
| Capacité | vinwAIve | Tableurs | Logiciels agricoles génériques | Outils viticoles traditionnels |
|---|---|---|---|---|
| Performance financière au niveau de la parcelle | Oui, en direct | Manuel, source d'erreurs | Indisponible | Partiel / fin de saison |
| Suivi objectif vs réalisé en feux tricolores | Oui, en saison | Mises à jour manuelles uniquement | Parfois | Parfois |
| Surveillance des ravageurs et maladies avec contexte financier | Oui | Non | Surveillance seule | Surveillance seule |
| Modélisation de scénarios sur la marge brute | Oui, recalcul en direct | Non | Non | Non |
| Comparaison des millésimes d'une année sur l'autre | Oui | Avec effort | Non | Variable |
| Traçabilité du produit vinicole à la parcelle | Oui | Non | Non | Rarement |
| Marge brute % par parcelle, par étiquette | Oui | Non | Non | Non |
| Prévision prédictive du chiffre d'affaires du millésime | Oui | Non | Non | Non |
| Interrogation en langage naturel par IA | Oui | Non | Non | Non |
| Flux météo et climat par propriété | Oui | Non | Parfois | Variable |
| Vue portefeuille multi-vignobles | Oui | Avec effort | Parfois | Variable |
| Conçu spécifiquement pour les domaines viticoles premium | Oui | Générique | Générique | Parfois |
Vos données sont déjà là. Nous nous y connectons.
Pas de projet informatique. Pas de migration de données. Pas de départ de zéro. vinwAIve relie les systèmes que votre domaine exploite déjà, importe les données qu'il produit déjà et vous rend opérationnel en une seule session d'intégration.
Import de tableurs
Chargez vos classeurs de rendement existants, vos données de parcelles et vos registres financiers. vinwAIve les analyse automatiquement, sans aucun reformatage. La plupart des domaines sont opérationnels en une seule session d'intégration.
Connexions aux systèmes
Reliez votre base de production, votre logiciel de comptabilité, vos portails de conformité et vos systèmes d'entrepôt pour que tout ce dont votre équipe a besoin tienne derrière un seul identifiant, avec des imports de données qui gardent l'image à jour tout au long de la saison.
Intégration accompagnée
Vous n'avez pas besoin d'une équipe informatique. Notre intégration cartographie la structure de votre domaine, vos parcelles, vos cépages et vos produits vinicoles dans la plateforme. Nous faisons la mise en place. Vous obtenez la visibilité, généralement dès la première session.
Tout ce que vous devez savoir
Qu'est-ce que vinwAIve ?
Pour qui vinwAIve est-il conçu ?
En quoi vinwAIve diffère-t-il des autres logiciels de gestion de vignoble ?
Que fait la surveillance des ravageurs et des maladies ?
Qu'est-ce que la modélisation de scénarios dans vinwAIve ?
vinwAIve peut-il comparer des millésimes ?
Quelles données vinwAIve connecte-t-il et analyse-t-il ?
vinwAIve peut-il gérer plusieurs vignobles ?
Comment fonctionne l'IA dans vinwAIve ?
Qu'est-ce que l'analyse du vignoble au niveau de la parcelle ?
Nous utilisons déjà un système de production de cave. vinwAIve le remplace-t-il ?
vinwAIve inclut-il des données météo ?
Et si nos données sont désordonnées ou incomplètes ?
Les données de notre vignoble sont-elles sécurisées et privées ?
Pouvons-nous contrôler qui accède à quelles données dans la plateforme ?
Voyez où votre domaine laisse de la marge dans le vignoble.
Parcourez la plateforme avec les données de votre propre domaine et voyez exactement à quoi ressemble la visibilité au niveau de la parcelle pour votre exploitation, avant que le prochain millésime ne soit déjà en marche.
Su finca está dejando margen en el viñedo. Solo que aún no puede ver dónde.
vinwAIve es la capa de inteligencia con IA para bodegas premium. Conecta los datos de rendimiento, operativos y financieros que su finca ya genera y deja que un analista de IA los convierta en la información que la dirección necesita para actuar, antes de que se pierda rendimiento, margen u oportunidad.
¿Qué es vinwAIve? vinwAIve es la capa de inteligencia IA para bodegas premium con múltiples viñedos: finanzas por sección, previsión de rendimiento en vivo, monitoreo de plagas y enfermedades, escenarios what-if y asignación de productos vinícolas en una sola plataforma potente, con un analista IA al que puede preguntar lo que quiera. La mayoría del software registra el pasado. vinwAIve impulsa la próxima decisión y convierte los datos que ya posee en rendimiento, margen y ROI mientras aún hay tiempo para actuar.
Cada añada toma decisiones con la mitad de la información.
Hojas de cálculo, mapas en papel, notas de campo en el teléfono de alguien, informes de fin de año de su contador. Los datos existen. Solo que están dispersos en seis lugares distintos, llegan demasiado tarde para actuar y nunca le dicen qué está pasando realmente a nivel de parcela.
Sus datos existen. Solo que no se comunican entre sí.
El rendimiento en una hoja de cálculo. Las finanzas con su contador. La presión de enfermedades en un cuaderno. Cada decisión se toma a partir de una imagen parcial construida a mano. vinwAIve lo conecta todo.
Cuando se entera, ya es demasiado tarde.
El informe de la añada llega seis semanas después de la vendimia. Las decisiones de la próxima temporada ya están en marcha. vinwAIve le da la misma imagen durante la campaña, cuando todavía hay tiempo para actuar.
El promedio de su finca está ocultando su peor parcela.
Una cifra global razonable puede esconder una brecha de 50 puntos de margen bruto entre sus mejores y peores parcelas. Los promedios de la finca no revelan los problemas. Los entierran.
No es un panel de control. Es una capa de inteligencia que piensa por su finca.
La mayoría del software para viñedos es un espejo retrovisor. vinwAIve está diseñado para que cada parcela, cada nota de campo, cada variedad y cada dólar alimenten una plataforma de inteligencia pensada para revelar lo importante mientras todavía hay tiempo para actuar.
Inteligencia predictiva
Pregunte qué entregará esta añada en ingresos, rendimiento y margen antes de que ocurra. vinwAIve modela resultados futuros a nivel de parcela, no promedios de la finca.
Alertas preventivas
Los semáforos muestran qué parcelas se están desviando de sus objetivos de rendimiento o costo mientras todavía hay tiempo para actuar. Señalado durante la campaña, no seis semanas después de la vendimia.
IA conversacional
Pregunte lo que quiera. ¿Qué parcelas debería priorizar? ¿Qué está causando la brecha de margen de mi Chardonnay? ¿Dónde tengo un déficit por SKU? Obtenga respuestas, no solo datos.
Una sola plataforma. Cada puesto en la mesa ve su propia pregunta respondida.
Los negocios del vino compran y operan en comité. vinwAIve le da a cada responsable la vista que le importa, extraída de los mismos datos conectados de la finca, para que todo el equipo trabaje sobre una sola versión de la verdad.
"¿Dónde estamos ganando y perdiendo dinero en toda la finca?"
Ingresos, beneficio bruto y riesgo a nivel de portafolio en una sola vista, con la posibilidad de bajar de la finca a la parcela en segundos.
"¿Dónde están los puntos críticos del negocio ahora mismo, del viñedo a las ventas y las finanzas?"
Semáforos que clasifican cada parcela frente a sus objetivos de rendimiento y costo, para que las prioridades de la semana se definan solas.
"¿Dónde están surgiendo riesgos de rendimiento, enfermedades y operativos?"
Monitoreo de campo, notas, madurez de la fruta y clima en un solo flujo, cada uno vinculado a la parcela, el tonelaje y el margen que afecta.
"¿Tenemos la fruta, la calidad y el volumen adecuados para nuestro programa de vinos?"
Oferta frente a demanda por SKU, trazabilidad de la parcela a la etiqueta y datos de madurez, sin tocar los informes de costos.
"¿Dónde se están desviando los costos y el margen respecto del plan?"
Costo por tonelada, ingresos por hectárea y margen bruto % por parcela y etiqueta, objetivo frente a real, actualizado durante toda la temporada.
"¿Vamos por buen camino, dónde está expuesto el negocio y dónde están las oportunidades?"
Una lectura clara de la trayectoria de la añada, el riesgo de suministro, los impulsores de margen y las oportunidades emergentes, con acceso de solo lectura para consejeros y asesores.
Permisos por rol integrados: un gerente de viñedo puede ver los datos de parcelas y monitoreo sin acceder a las finanzas de la empresa, un enólogo puede ver las asignaciones sin los informes de costos, y los consultores o consejeros obtienen acceso de solo lectura. El administrador de la cuenta controla quién ve qué.
No solo verá más. Decidirá mejor.
- ¿Qué parcelas necesitan intervención ahora, y cuáles conviene dejar tranquilas?
- ¿Dónde es probable que no alcancemos nuestro objetivo de rendimiento o margen?
- ¿Qué viñedos están impulsando, o destruyendo, la rentabilidad?
- ¿Dónde tendremos excedentes o faltantes de fruta por SKU?
- ¿Qué parcelas merecen otro dólar de inversión, y cuáles hay que reevaluar?
- ¿Qué pasa con el beneficio si cambia el rendimiento, el precio o la calidad?
Vea los problemas antes de la vendimia, no durante
Section Intelligence clasifica cada parcela con un semáforo frente a sus objetivos de rendimiento y costo: en camino, 10% desviada, 15% o más desviada. Cuando una parcela empieza a desviarse, usted lo ve con semanas de anticipación, mapeado y clasificado por impacto.
→ Clasificación por semáforo de cada parcela, en vivo durante toda la añada
Su cuenta de resultados por parcela durante la campaña, no seis semanas después de la vendimia
Ingresos por hectárea, margen de beneficio bruto y costo por tonelada a nivel de parcela, objetivo frente a real, actualizados durante toda la temporada. No una cifra promediada de la finca. El desempeño real de cada parcela, mientras todavía influye en sus decisiones.
→ $/ha, $/tonelada y margen bruto % por parcela, durante toda la añada
Qué productos de vino le están haciendo ganar dinero realmente
Rastree cada parcela hasta la etiqueta que alimenta. Vea la oferta frente a la demanda por SKU en toneladas y equivalentes de cajas de 9 litros, con excedentes y déficits señalados por producto. Tome decisiones de asignación, replantación y precios a partir de datos reales de margen en lugar de suposiciones.
→ De la vid a la botella, con el margen conectado
Previsiones de rendimiento siempre actualizadas, sin rehacer nada
Muestras de rendimiento evaluadas en campo por parcela, por etapa de crecimiento, consolidadas en vivo en toda la finca. Los compromisos de suministro, los calendarios de bodega y la logística de vendimia funcionan con datos actuales en lugar de los resultados del año pasado y la intuición. El avance de la vendimia registra la fruta conservada frente a la vendida contra la estimación a medida que llega.
→ Previsiones por parcela y seguimiento de vendimia, actualizados durante toda la añada
Cada propiedad y cada parcela, lado a lado
¿Gestiona más de una propiedad? vinwAIve le da una sola vista de todos sus viñedos con detalle a nivel de parcela bajo demanda: agrupe por propiedad, variedad, categoría o nivel de calidad y compare lado a lado.
→ Cualquier propiedad, cualquier parcela, lado a lado
Pregúntele lo que quiera a su finca. Obtenga la respuesta en segundos.
¿Qué parcelas están por debajo del objetivo de rendimiento? ¿Dónde tengo un déficit por SKU? Cuéntame sobre la parcela KA-PN03. Respuestas en lenguaje natural basadas en los datos reales de su finca. Sin tablas dinámicas. Sin reconstrucciones de tres horas.
→ Lenguaje natural sobre el conjunto completo de datos de su finca
Lo que pasa entre las hileras, no solo en la contabilidad.
vinwAIve ahora gestiona las operaciones de su viñedo junto con sus finanzas, para que el monitoreo, las notas de campo, la madurez y el clima vivan en la misma plataforma que sus márgenes, y la IA razone sobre todo ello.
Monitoreo de plagas y enfermedades
Observaciones de campo estructuradas sobre enfermedades, plagas, insectos benéficos y desórdenes. Filtre por viñedo, variedad, nivel de calidad o parcela, con un flujo de borrador y publicación que todo su equipo puede usar desde el campo.
Observaciones de campo
Un flujo en vivo de notas publicadas desde el viñedo, cada una etiquetada como Bien, Atención o Alerta y vinculada a una parcela. Toque un código de parcela y se abren al lado su detalle completo, su historial y sus finanzas.
Madurez de la fruta
Muestreo de madurez por parcela seguido a lo largo de la curva de maduración, junto a la estimación de rendimiento y la cuenta de resultados de esa misma parcela, para que las decisiones de cosecha equilibren sabor, tonelaje y margen.
Clima y meteorología
Datos en vivo de estaciones meteorológicas por propiedad, pronósticos de distrito y datos estacionales integrados en la plataforma. Las integraciones de humedad del suelo y riego son lo siguiente en la hoja de ruta.
Inteligencia por parcela
Cada observación, muestra y dólar se consolida en una clasificación por semáforo de sus parcelas según rendimiento y costo frente al objetivo, para que las prioridades del día se definan solas.
Un solo cerebro para todo
Como las operaciones y las finanzas comparten una sola plataforma, la IA puede conectar una alerta de enfermedad con un riesgo de rendimiento y con el impacto en el margen de la etiqueta que esa parcela alimenta.
Conozca la consecuencia financiera antes de tomar la decisión
¿Qué pasa con el beneficio bruto si el rendimiento cae un 10%? ¿Si sube una parcela de nivel de calidad? ¿Si el mercado paga un 5% menos? Escenarios le permite mover palancas de oferta y demanda y ver cómo el impacto en toneladas, ingresos, gastos operativos y margen bruto se recalcula en vivo frente a la línea base de su añada actual.
→ Palancas de oferta y demanda, impacto en el margen bruto en vivo frente a su línea base
Gestione esta añada. Planifique la siguiente. Compare las últimas tres.
vinwAIve gestiona el ciclo de vida completo de la añada: avance la añada actual por sus etapas, ciérrela con un registro de auditoría limpio y active la siguiente, mientras la Comparación de Añadas pone lado a lado el rendimiento, las toneladas y los objetivos año contra año. Cada objetivo que fije se contrasta con lo que la misma parcela entregó realmente antes, para que el plan de la próxima temporada se construya sobre evidencia y no sobre optimismo.
→ Ciclo de vida de la añada, comparación año contra año, objetivos con memoria
No es un chatbot añadido. Es un analista que razona sobre toda su finca.
Esto es lo que cambia el juego. La IA de vinwAIve conecta rendimiento, operaciones, costos, asignación y desempeño financiero en un solo modelo en vivo de su finca, y luego razona sobre todo ello. Las preguntas que antes le tomaban tres días a un analista y una pila de hojas de cálculo ahora toman una frase y unos segundos.
"¿Qué parcelas están por debajo de su objetivo de rendimiento ahora mismo, y cuáles están en riesgo de no alcanzar su margen bruto?"
"¿Dónde tengo un déficit de oferta frente a la demanda, y qué productos de vino están más expuestos?"
"Resume el beneficio bruto por viñedo y dime qué propiedad está arrastrando hacia abajo el margen de mi finca."
"¿Qué parcelas están reduciendo el margen bruto combinado de mi etiqueta reserva? ¿Qué pasa si saco la más débil?"
"Muéstrame todas las observaciones con Alerta de las últimas dos semanas y la tendencia de rendimiento en esas parcelas."
"Con base en esta añada, ¿en qué parcelas debería aumentar la inversión el próximo año, y cuáles debería reevaluar?"
Personalizable para su negocio. No adapte sus informes a las limitaciones de las bases de datos tradicionales. Pídale a vinwAIve que informe sobre los aspectos que más le importan.
Adoptar algo nuevo debería reducir su riesgo, no aumentarlo.
vinwAIve está diseñado para demostrar su valor con sus propios datos, y para asentarse sobre los sistemas en los que ya confía en lugar de reemplazarlos.
Compruébelo con sus propios datos
Vea exactamente cómo es la visibilidad a nivel de parcela para su operación, en un recorrido guiado con sus propios datos de rendimiento y financieros, antes de cualquier compromiso.
Sin arrancar y reemplazar
vinwAIve enlaza sus sistemas de producción, contabilidad, cumplimiento y almacén, e importa sus hojas de cálculo. La capa de inteligencia se asienta sobre lo que usted ya usa.
Operativo en una sola sesión de incorporación
Sin proyecto de TI y sin migración de datos. Mapeamos la estructura de su finca y conectamos sus sistemas, de modo que la mayoría de las fincas están operando en una sola sesión.
vinwAIve se sitúa en el centro de los sistemas que usted ya usa.
Sin arrancar y reemplazar. vinwAIve enlaza los sistemas de producción, contabilidad, cumplimiento y almacén que su finca ya utiliza, e importa sus hojas de cálculo existentes, de modo que la capa de inteligencia se asienta sobre todo lo demás.
Cada número que genera su finca. Por fin conectado.
Desempeño financiero
- Ingresos totales de vino frente al objetivo
- Gastos operativos del viñedo y costo por hectárea
- Ingresos por hectárea por parcela y viñedo
- Margen de beneficio bruto %, a nivel de parcela y de finca
- Costo por tonelada: variación objetivo frente a real
- Trayectoria del margen bruto % durante la campaña frente al cierre de añada
Inteligencia de rendimiento
- Rendimiento total de la finca: objetivo frente a previsión actual
- Muestras evaluadas en campo por parcela, por etapa de crecimiento
- Desglose de rendimiento por variedad
- Toneladas por hectárea: objetivo frente a previsión frente a final
- Avance de la vendimia: conservada frente a vendida, en vivo
- Referencias históricas de rendimiento por parcela
Inteligencia de operaciones
- Observaciones de monitoreo de plagas y enfermedades
- Notas de campo: Bien / Atención / Alerta por parcela
- Muestreo de madurez de la fruta por parcela
- Estaciones meteorológicas en vivo y pronósticos de distrito
- Clasificación de parcelas por semáforo, rendimiento y costo
- Datos vitícolas estacionales y regionales
Producto de vino y asignación
- Mapeo de asignación de parcela a etiqueta de vino
- Margen bruto % e ingresos por hectárea por producto de vino
- Oferta frente a demanda por SKU: toneladas y cajas equivalentes de 9 litros
- Excedentes y déficits señalados por producto
- Contribución de múltiples productos al margen bruto de la finca
- Consolidados por categoría y nivel de calidad
Escenarios y planificación de añadas
- Palancas hipotéticas: rendimiento, calidad, precio, costo, mezcla
- Impacto en el margen bruto en vivo frente a la línea base de la añada actual
- Comparación de añadas año contra año
- Ciclo de vida de la añada: etapas, cierre, activación
- Objetivos de la próxima añada construidos sobre resultados reales
- Resumen continuo de variaciones en toda la finca
Información impulsada por IA
- Alertas de semáforo: parcelas que se desvían del objetivo
- Previsiones predictivas de ingresos y margen de la añada
- Análisis de causa raíz para cada variación
- Identificación de parcelas sobresalientes
- Recomendaciones de asignación a partir de datos en vivo
- Preguntas y respuestas en lenguaje natural sobre toda la finca
¿Sigue operando con hojas de cálculo y un informe de añada de hace seis semanas?
| Capacidad | vinwAIve | Hojas de cálculo | Software agrícola genérico | Herramientas de viñedo tradicionales |
|---|---|---|---|---|
| Desempeño financiero a nivel de parcela | Sí, en vivo | Manual, propenso a errores | No disponible | Parcial / fin de temporada |
| Seguimiento por semáforo de objetivo frente a real | Sí, durante la campaña | Solo actualizaciones manuales | A veces | A veces |
| Monitoreo de plagas y enfermedades con contexto financiero | Sí | No | Solo monitoreo | Solo monitoreo |
| Modelado de escenarios hipotéticos sobre el margen bruto | Sí, recálculo en vivo | No | No | No |
| Comparación de añadas año contra año | Sí | Con esfuerzo | No | Varía |
| Trazabilidad del producto de vino a la parcela | Sí | No | No | Rara vez |
| Margen bruto % por parcela, por etiqueta de vino | Sí | No | No | No |
| Previsión predictiva de ingresos de la añada | Sí | No | No | No |
| Consultas en lenguaje natural con IA | Sí | No | No | No |
| Datos de clima y meteorología por propiedad | Sí | No | A veces | Varía |
| Vista de portafolio de múltiples viñedos | Sí | Con esfuerzo | A veces | Varía |
| Diseñado específicamente para bodegas premium | Sí | Genérico | Genérico | A veces |
Sus datos ya están ahí. Nosotros nos conectamos a ellos.
Sin proyecto de TI. Sin migración de datos. Sin empezar de cero. vinwAIve enlaza los sistemas que su finca ya utiliza e importa los datos que ya produce, y lo deja operando en una sola sesión de incorporación.
Importación de hojas de cálculo
Suba sus libros de rendimiento, datos de parcelas y registros financieros existentes. vinwAIve los procesa automáticamente, sin necesidad de reformatear. La mayoría de las fincas están operando en una sola sesión de incorporación.
Conexiones con sistemas
Enlace su base de datos de producción, software de contabilidad, portales de cumplimiento y sistemas de almacén para que todo lo que su equipo necesita esté detrás de un solo inicio de sesión, con importaciones de datos que mantienen la imagen actualizada durante la temporada.
Incorporación guiada
No necesita un equipo de TI. Nuestra incorporación mapea la estructura de su finca, sus parcelas, variedades y productos de vino en la plataforma. Nosotros hacemos la configuración. Usted obtiene la visibilidad, normalmente en la primera sesión.
Todo lo que necesita saber
¿Qué es vinwAIve?
¿Para quién está diseñado vinwAIve?
¿En qué se diferencia vinwAIve de otro software de gestión de viñedos?
¿Qué hace el monitoreo de plagas y enfermedades?
¿Qué es el modelado de escenarios en vinwAIve?
¿Puede vinwAIve comparar añadas?
¿Qué datos conecta y analiza vinwAIve?
¿Puede vinwAIve gestionar múltiples viñedos?
¿Cómo funciona la IA en vinwAIve?
¿Qué es la analítica de viñedos a nivel de parcela?
Ya usamos un sistema de producción de bodega. ¿vinwAIve lo reemplaza?
¿vinwAIve incluye datos meteorológicos?
¿Y si nuestros datos están desordenados o incompletos?
¿Los datos de nuestro viñedo están seguros y son privados?
¿Podemos controlar quién tiene acceso a qué datos dentro de la plataforma?
Vea dónde su finca está dejando margen en el viñedo.
Recorra la plataforma con los datos de su propia finca y vea exactamente cómo es la visibilidad a nivel de parcela para su operación, antes de que la próxima añada ya esté en marcha.
Ihr Weingut lässt Marge im Weinberg liegen. Sie sehen nur noch nicht, wo.
vinwAIve ist die KI-Intelligenzschicht für Premium-Weingüter. Sie verbindet die Ertrags-, Betriebs- und Finanzdaten, die Sie bereits erzeugen, und lässt einen KI-Analysten daraus die Erkenntnisse gewinnen, die das Management zum Handeln braucht, bevor Ertrag, Marge oder Chancen verloren gehen.
Was ist vinwAIve? vinwAIve ist die KI-Intelligenzschicht für Premium-Weingüter mit mehreren Weinbergen: Finanzen auf Parzellenebene, Live-Ertragsprognosen, Schädlings- und Krankheitsmonitoring, Was-wäre-wenn-Szenarien und Produktallokation in einer leistungsstarken Plattform, mit einem KI-Analysten für jede Frage. Die meiste Software dokumentiert die Vergangenheit. vinwAIve treibt die nächste Entscheidung und verwandelt vorhandene Daten in Ertrag, Marge und ROI, solange noch Zeit zum Handeln bleibt.
Jeden Jahrgang entscheiden Sie mit dem halben Bild.
Tabellen, Papierkarten, Bonitur-Notizen auf irgendeinem Handy, Jahresberichte vom Steuerberater. Die Daten sind da. Sie sind nur über sechs verschiedene Orte verstreut, kommen zu spät zum Handeln an und verraten nie, was auf Parzellenebene wirklich passiert.
Ihre Daten existieren. Sie sprechen nur nicht miteinander.
Der Ertrag in einer Tabelle. Die Finanzen beim Steuerberater. Der Krankheitsdruck in einem Notizbuch. Jede Entscheidung entsteht aus einem von Hand zusammengesetzten Teilbild. vinwAIve verbindet alles.
Wenn Sie es erfahren, ist es schon zu spät.
Der Jahrgangsbericht kommt sechs Wochen nach der Lese. Die Entscheidungen für die nächste Saison sind längst getroffen. vinwAIve liefert Ihnen dasselbe Bild während der Saison, solange noch Zeit zum Handeln bleibt.
Ihr Gutsdurchschnitt versteckt Ihre schwächste Parzelle.
Eine ordentliche Gesamtzahl kann eine Spanne von 50 Punkten Rohertragsmarge zwischen Ihrer besten und schwächsten Parzelle verdecken. Durchschnittswerte decken Probleme nicht auf. Sie begraben sie.
Kein Dashboard. Eine Intelligenzschicht, die für Ihr Weingut mitdenkt.
Die meiste Weinbergssoftware ist ein Rückspiegel. vinwAIve ist so gebaut, dass jede Parzelle, jede Bonitur-Notiz, jede Rebsorte und jeder Euro in eine Intelligenzplattform einfließt, die das Wesentliche sichtbar macht, solange noch Zeit zum Handeln bleibt.
Prädiktive Intelligenz
Fragen Sie, was dieser Jahrgang an Umsatz, Ertrag und Marge liefern wird, bevor er es tut. vinwAIve modelliert künftige Ergebnisse auf Parzellenebene, nicht als Gutsdurchschnitt.
Präventive Erkenntnisse
Ampel-Rankings zeigen, welche Parzellen von Ertrags- oder Kostenzielen abdriften, solange noch Zeit zum Handeln bleibt. Gemeldet während der Saison, nicht sechs Wochen nach der Lese.
Konversationelle KI
Fragen Sie alles. Welche Parzellen sollte ich priorisieren? Was treibt die Margenlücke bei meinem Chardonnay? Wo habe ich ein SKU-Defizit? Sie bekommen Antworten, nicht nur Daten.
Eine Plattform. Jeder am Tisch bekommt seine eigene Frage beantwortet.
Weingüter kaufen und führen im Team. vinwAIve gibt jedem Entscheider genau die Sicht, die für ihn zählt, gespeist aus denselben verbundenen Gutsdaten, damit das ganze Team mit einer einzigen Version der Wahrheit arbeitet.
„Wo verdienen und wo verlieren wir Geld im gesamten Weingut?“
Umsatz, Rohertrag und Risiko auf Portfolioebene in einer Ansicht, mit Drilldown vom Gesamtgut bis zur Parzelle in Sekunden.
„Wo brennt es gerade im Unternehmen, vom Weinberg bis zu Vertrieb und Finanzen?“
Ampel-Rankings jeder Parzelle gegenüber Ertrags- und Kostenzielen, sodass sich die Prioritäten der Woche von selbst ergeben.
„Wo entstehen gerade Ertrags-, Krankheits- und Betriebsrisiken?“
Bonituren, Feldnotizen, Traubenreife und Wetter in einem Feed, jeweils verknüpft mit der Parzelle, der Tonnage und der Marge, die sie betreffen.
„Haben wir die richtigen Trauben, die richtige Qualität und Menge für unser Weinprogramm?“
Angebot gegen Nachfrage je SKU, Rückverfolgbarkeit von der Parzelle bis zum Etikett und Reifedaten, ganz ohne Kostenberichte.
„Wo weichen Kosten und Marge vom Plan ab?“
Kosten pro Tonne, Umsatz pro Hektar und Rohertragsmarge % je Parzelle und Etikett, Ziel gegen Ist, laufend aktualisiert über die Saison.
„Sind wir auf Kurs, wo ist das Unternehmen exponiert, und wo liegen die Chancen?“
Ein klarer Blick auf Jahrgangsverlauf, Versorgungsrisiken, Margentreiber und neue Chancen, mit Lesezugriff für Beiräte und Berater.
Rollenbasierte Berechtigungen sind eingebaut: Ein Weinbergsleiter sieht Parzellen- und Boniturdaten ohne die Unternehmensfinanzen, ein Kellermeister sieht Zuteilungen ohne Kostenberichte, und Berater oder Beiräte erhalten Lesezugriff. Der Konto-Administrator steuert, wer was sieht.
Sie sehen nicht nur mehr. Sie entscheiden besser.
- Welche Parzellen brauchen jetzt einen Eingriff, und welche lässt man in Ruhe?
- Wo werden wir unser Ertrags- oder Margenziel voraussichtlich verfehlen?
- Welche Weinberge treiben die Profitabilität, und welche zerstören sie?
- Wo entstehen Traubenüberschüsse oder -engpässe je SKU?
- Welche Parzellen verdienen einen weiteren Euro Investition, und welche gehören auf den Prüfstand?
- Was passiert mit dem Gewinn, wenn sich Ertrag, Preis oder Qualität ändern?
Probleme vor der Lese sehen, nicht mittendrin
Section Intelligence bewertet jede Parzelle per Ampel gegenüber ihren Ertrags- und Kostenzielen: auf Kurs, 10% daneben, 15% oder mehr daneben. Wenn eine Parzelle abzudriften beginnt, sehen Sie es Wochen im Voraus, kartiert und nach Auswirkung sortiert.
→ Ampel-Ranking jeder Parzelle, live über den ganzen Jahrgang
Ihre Parzellen-GuV während der Saison, nicht sechs Wochen nach der Lese
Umsatz pro Hektar, Rohertragsmarge und Kosten pro Tonne auf Parzellenebene, Ziel gegen Ist, laufend aktualisiert über die Saison. Keine verwässerte Gesamtzahl. Die tatsächliche Performance jeder Parzelle, solange sie Ihre Entscheidungen noch beeinflusst.
→ €/ha, €/Tonne und Rohertragsmarge % je Parzelle, den ganzen Jahrgang lang
Welche Weinprodukte Ihnen wirklich Geld einbringen
Verfolgen Sie jede Parzelle bis zu dem Etikett, das sie beliefert. Sehen Sie Angebot gegen Nachfrage je SKU in Tonnen und 9-Liter-Kistenäquivalenten, mit Überschuss und Defizit je Produkt markiert. Treffen Sie Zuteilungs-, Neupflanzungs- und Preisentscheidungen auf Basis echter Margendaten statt Annahmen.
→ Von der Rebe bis zur Flasche, mit verbundener Marge
Ertragsprognosen, die aktuell bleiben, ohne alles neu zu bauen
Im Feld erfasste Ertragsproben je Parzelle, nach Wachstumsstadium, live über das gesamte Weingut aggregiert. Lieferzusagen, Kellerpläne und Erntelogistik laufen auf aktuellen Daten statt auf den Vorjahreszahlen und einem Bauchgefühl. Der Erntefortschritt verfolgt behaltene gegen verkaufte Trauben laufend gegen die Schätzung.
→ Prognosen je Parzelle und Ernteverfolgung, laufend aktualisiert über den Jahrgang
Jedes Gut und jede Parzelle, Seite an Seite
Sie bewirtschaften mehr als ein Gut? vinwAIve gibt Ihnen eine Ansicht über alle Weinberge mit parzellengenauem Detail auf Abruf: gruppieren Sie nach Gut, Rebsorte, Kategorie oder Qualitätsstufe und vergleichen Sie direkt nebeneinander.
→ Jedes Gut, jede Parzelle, Seite an Seite
Fragen Sie Ihr Weingut, was Sie wollen. Die Antwort kommt in Sekunden.
Welche Parzellen liegen unter dem Ertragsziel? Wo habe ich ein SKU-Defizit? Erzähl mir etwas über Parzelle KA-PN03. Antworten in Klartext, gestützt auf die echten Daten Ihres Weinguts. Keine Pivot-Tabellen. Kein dreistündiger Neuaufbau.
→ Natürliche Sprache über Ihren gesamten Gutsdatenbestand
Was in den Rebzeilen passiert, nicht nur in der Buchhaltung.
vinwAIve führt jetzt Ihren Weinbergsbetrieb parallel zu Ihren Finanzen, sodass Bonituren, Feldnotizen, Reife und Wetter in derselben Plattform leben wie Ihre Margen, und die KI über alles hinweg mitdenkt.
Schädlings- & Krankheitsmonitoring
Strukturierte Bonituren zu Krankheiten, Schädlingen, Nützlingen und Störungen. Filtern nach Weinberg, Rebsorte, Qualitätsstufe oder Parzelle, mit einem Entwurf-und-Veröffentlichen-Workflow, den das ganze Team direkt vom Feld aus nutzen kann.
Feldbeobachtungen
Ein Live-Feed mit Notizen aus dem Weinberg, jede markiert als Gut, Bedenken oder Alarm und einer Parzelle zugeordnet. Ein Tipp auf den Parzellencode öffnet direkt daneben alle Details, die Historie und die Finanzzahlen.
Traubenreife
Parzellengenaue Reifeproben, verfolgt entlang der Reifekurve, direkt neben der Ertragsschätzung und der GuV derselben Parzelle, damit Leseentscheidungen Aroma, Tonnage und Marge in Einklang bringen.
Wetter & Klima
Live-Wetterstationsdaten je Gut, regionale Vorhersagen und Saisondaten direkt in der Plattform. Integrationen für Bodenfeuchte und Bewässerung stehen als Nächstes auf der Roadmap.
Section Intelligence
Jede Beobachtung, jede Probe und jeder Euro fließt in ein Ampel-Ranking Ihrer Parzellen nach Ertrag und Kosten gegenüber dem Ziel, sodass sich die Prioritäten des Tages von selbst ergeben.
Ein Gehirn über allem
Weil Betrieb und Finanzen eine Plattform teilen, kann die KI eine Krankheitsmeldung mit einem Ertragsrisiko und der Margenwirkung auf das Etikett verbinden, das diese Parzelle beliefert.
Die finanziellen Folgen kennen, bevor Sie entscheiden
Was passiert mit dem Rohertrag, wenn der Ertrag um 10% sinkt? Wenn Sie eine Parzelle eine Qualitätsstufe höher einstufen? Wenn der Markt 5% weniger zahlt? Mit Szenarien bewegen Sie Angebots- und Nachfragehebel und sehen live, wie sich Tonnen, Umsatz, OpEx und Rohertrag gegenüber Ihrer aktuellen Jahrgangsbasis neu berechnen.
→ Angebots- und Nachfragehebel, Rohertragswirkung live gegen Ihre Basis
Diesen Jahrgang steuern. Den nächsten planen. Die letzten drei vergleichen.
vinwAIve verwaltet den gesamten Lebenszyklus eines Jahrgangs: den laufenden Jahrgang durch seine Phasen führen, mit sauberem Prüfpfad abschließen und den nächsten aufsetzen, während der Jahrgangsvergleich Ertrag, Tonnen und Ziele Jahr für Jahr nebeneinanderstellt. Jedes Ziel, das Sie setzen, wird daran gemessen, was dieselbe Parzelle zuvor tatsächlich geliefert hat, damit der Plan für die nächste Saison auf Fakten statt auf Optimismus beruht.
→ Jahrgangslebenszyklus, Jahresvergleich, Ziele mit Gedächtnis
Kein angeschraubter Chatbot. Ein Analyst, der über Ihr gesamtes Weingut hinweg denkt.
Das ist der Punkt, der alles verändert. Die KI von vinwAIve verbindet Ertrag, Betrieb, Kosten, Zuteilung und Finanzperformance zu einem lebendigen Modell Ihres Weinguts und denkt über alles hinweg mit. Die Fragen, für die ein Analyst früher drei Tage und einen Stapel Tabellen brauchte, kosten jetzt einen Satz und ein paar Sekunden.
„Welche Parzellen liegen gerade unter ihrem Ertragsziel, und welche drohen ihre Rohertragsmarge zu verfehlen?“
„Wo habe ich ein Angebotsdefizit gegenüber der Nachfrage, und welche Weinprodukte sind am stärksten betroffen?“
„Fasse den Rohertrag je Weinberg zusammen und sage mir, welches Gut die Marge des gesamten Weinguts nach unten zieht.“
„Welche Parzellen drücken die gemischte Rohertragsmarge meines Reserve-Etiketts? Was passiert, wenn ich die schwächste herausnehme?“
„Zeig mir jede Alarm-Beobachtung der letzten zwei Wochen und den Ertragstrend in diesen Parzellen.“
„In welche Parzellen sollte ich auf Basis dieses Jahrgangs nächstes Jahr mehr investieren, und welche gehören auf den Prüfstand?“
Anpassbar an Ihr Unternehmen. Passen Sie Ihr Reporting nicht an die Grenzen klassischer Datenbanken an. Bitten Sie vinwAIve, über genau die Aspekte zu berichten, die für Sie am wichtigsten sind.
Etwas Neues einzuführen sollte Ihr Risiko senken, nicht erhöhen.
vinwAIve ist darauf ausgelegt, seinen Wert an Ihren eigenen Daten zu beweisen und über den Systemen zu sitzen, denen Sie bereits vertrauen, statt sie zu ersetzen.
Beweis an Ihren eigenen Daten
Sehen Sie genau, wie parzellengenaue Transparenz für Ihren Betrieb aussieht, durchgespielt mit Ihren eigenen Ertrags- und Finanzdaten, vor jeder Verpflichtung.
Kein Herausreißen und Ersetzen
vinwAIve verknüpft Ihre Produktions-, Buchhaltungs-, Compliance- und Lagersysteme und importiert Ihre Tabellen. Die Intelligenzschicht legt sich über das, was Sie bereits betreiben.
Live in einer Onboarding-Sitzung
Kein IT-Projekt und keine Datenmigration. Wir bilden Ihre Gutsstruktur ab und verbinden Ihre Systeme, sodass die meisten Weingüter innerhalb einer einzigen Sitzung startklar sind.
vinwAIve sitzt im Zentrum der Systeme, die Sie bereits betreiben.
Kein Herausreißen und Ersetzen. vinwAIve verknüpft die Produktions-, Buchhaltungs-, Compliance- und Lagersysteme, die Ihr Weingut bereits nutzt, und importiert Ihre bestehenden Tabellen, sodass sich die Intelligenzschicht über alles legt.
Jede Zahl, die Ihr Weingut erzeugt. Endlich verbunden.
Finanzperformance
- Gesamter Weinumsatz gegen Ziel
- Weinbergs-OpEx und Kosten pro Hektar
- Umsatz pro Hektar je Parzelle und Weinberg
- Rohertragsmarge % auf Parzellen- und Gutsebene
- Kosten pro Tonne: Abweichung Ziel gegen Ist
- Verlauf der Rohertragsmarge % während der Saison gegen das Jahrgangsende
Ertragsintelligenz
- Gesamtertrag des Weinguts: Ziel gegen aktuelle Prognose
- Im Feld erfasste Proben je Parzelle, nach Wachstumsstadium
- Ertragsaufschlüsselung nach Rebsorte
- Tonnen pro Hektar: Ziel gegen Prognose gegen Endergebnis
- Erntefortschritt: behalten gegen verkauft, live
- Historisches Ertragsbenchmarking je Parzelle
Betriebsintelligenz
- Bonituren zu Schädlingen und Krankheiten
- Feldnotizen: Gut / Bedenken / Alarm je Parzelle
- Reifeproben je Parzelle
- Live-Wetterstationen und regionale Vorhersagen
- Ampel-Rankings der Parzellen, Ertrag und Kosten
- Saisonale und regionale Weinbaudaten
Weinprodukte & Zuteilung
- Zuordnung von Parzelle zu Wein-Etikett
- Rohertragsmarge % und Umsatz pro Hektar je Weinprodukt
- Angebot gegen Nachfrage je SKU: Tonnen und 9-Liter-Kisten
- Überschuss und Defizit je Produkt markiert
- Beitrag mehrerer Produkte zum Rohertrag des Weinguts
- Roll-ups nach Kategorie und Qualitätsstufe
Szenario- & Jahrgangsplanung
- Was-wäre-wenn-Hebel: Ertrag, Qualität, Preis, Kosten, Mix
- Live-Rohertragswirkung gegen die aktuelle Jahrgangsbasis
- Jahrgangsvergleich Jahr für Jahr
- Jahrgangslebenszyklus: Phase, Abschluss, Übergang
- Ziele für den nächsten Jahrgang auf Basis der Ist-Zahlen
- Rollierende Abweichungsübersicht über das ganze Weingut
KI-gestützte Erkenntnisse
- Ampel-Warnungen: Parzellen, die vom Ziel abdriften
- Prädiktive Umsatz- und Margenprognosen je Jahrgang
- Ursachenanalyse für jede Abweichung
- Identifikation von Überperformern
- Zuteilungsempfehlungen aus Live-Daten
- Fragen und Antworten in natürlicher Sprache über das gesamte Weingut
Arbeiten Sie noch mit Tabellen und einem sechs Wochen alten Jahrgangsbericht?
| Funktion | vinwAIve | Tabellen | Generische Agrarsoftware | Klassische Weinbergstools |
|---|---|---|---|---|
| Parzellengenaue Finanzperformance | Ja, live | Manuell, fehleranfällig | Nicht verfügbar | Teilweise / Saisonende |
| Ampel-Tracking Ziel gegen Ist | Ja, während der Saison | Nur manuelle Updates | Manchmal | Manchmal |
| Schädlings- & Krankheitsbonitur mit Finanzkontext | Ja | Nein | Nur Bonitur | Nur Bonitur |
| Was-wäre-wenn-Szenarien auf den Rohertrag | Ja, live neu berechnet | Nein | Nein | Nein |
| Jahrgangsvergleich Jahr für Jahr | Ja | Mit Aufwand | Nein | Unterschiedlich |
| Rückverfolgbarkeit vom Weinprodukt zur Parzelle | Ja | Nein | Nein | Selten |
| Rohertragsmarge % je Parzelle, je Wein-Etikett | Ja | Nein | Nein | Nein |
| Prädiktive Umsatzprognose je Jahrgang | Ja | Nein | Nein | Nein |
| KI-Abfragen in natürlicher Sprache | Ja | Nein | Nein | Nein |
| Wetter- & Klimadaten je Gut | Ja | Nein | Manchmal | Unterschiedlich |
| Portfolioansicht über mehrere Weinberge | Ja | Mit Aufwand | Manchmal | Unterschiedlich |
| Speziell für Premium-Weingüter gebaut | Ja | Generisch | Generisch | Manchmal |
Ihre Daten sind schon da. Wir verbinden sie.
Kein IT-Projekt. Keine Datenmigration. Kein Neuanfang. vinwAIve verknüpft die Systeme, die Ihr Weingut bereits betreibt, importiert die Daten, die es ohnehin erzeugt, und macht Sie innerhalb einer einzigen Onboarding-Sitzung startklar.
Tabellenimport
Laden Sie Ihre bestehenden Ertragsmappen, Parzellendaten und Finanzunterlagen hoch. vinwAIve liest sie automatisch ein, ohne Umformatieren. Die meisten Weingüter sind innerhalb einer einzigen Onboarding-Sitzung startklar.
Systemverbindungen
Verknüpfen Sie Ihre Produktionsdatenbank, Buchhaltungssoftware, Compliance-Portale und Lagersysteme, sodass alles, was Ihr Team braucht, hinter einem Login liegt, während Datenimporte das Bild über die Saison aktuell halten.
Begleitetes Onboarding
Sie brauchen kein IT-Team. Unser Onboarding bildet Ihre Gutsstruktur, Parzellen, Rebsorten und Weinprodukte in der Plattform ab. Wir übernehmen die Einrichtung. Sie bekommen die Transparenz, meist schon in der ersten Sitzung.
Alles, was Sie wissen müssen
Was ist vinwAIve?
Für wen ist vinwAIve gebaut?
Wie unterscheidet sich vinwAIve von anderer Weinbergsmanagement-Software?
Was leistet das Schädlings- und Krankheitsmonitoring?
Was ist Szenariomodellierung in vinwAIve?
Kann vinwAIve Jahrgänge vergleichen?
Welche Daten verbindet und analysiert vinwAIve?
Kann vinwAIve mehrere Weinberge verwalten?
Wie funktioniert die KI in vinwAIve?
Was ist parzellengenaue Weinbergsanalytik?
Wir nutzen bereits ein Kellerei-Produktionssystem. Ersetzt vinwAIve es?
Enthält vinwAIve Wetterdaten?
Was, wenn unsere Daten unordentlich oder unvollständig sind?
Sind unsere Weinbergsdaten sicher und vertraulich?
Können wir steuern, wer in der Plattform auf welche Daten zugreift?
Sehen Sie, wo Ihr Weingut Marge im Weinberg liegen lässt.
Gehen Sie die Plattform mit Ihren eigenen Gutsdaten durch und sehen Sie genau, wie parzellengenaue Transparenz für Ihren Betrieb aussieht, bevor der nächste Jahrgang bereits läuft.
La tua tenuta sta lasciando margine nel vigneto. Solo che ancora non vedi dove.
vinwAIve è il livello di intelligence AI per le tenute vinicole premium. Collega i dati di resa, operativi e finanziari che già generi e li affida a un analista AI che li trasforma nelle informazioni di cui la direzione ha bisogno per agire, prima che resa, margine o opportunità vadano persi.
Che cos'è vinwAIve? vinwAIve è il livello di intelligenza AI per le aziende vinicole premium multi-vigneto: finanza a livello di parcella, previsioni di resa in tempo reale, monitoraggio di parassiti e malattie, scenari what-if e allocazione dei prodotti in un'unica piattaforma potente, con un analista AI a cui chiedere qualsiasi cosa. La maggior parte dei software registra il passato. vinwAIve guida la prossima decisione e trasforma i dati che già possedete in resa, margine e ROI, finché c'è ancora tempo per agire.
Ogni annata prendi decisioni con metà del quadro.
Fogli di calcolo, mappe cartacee, note di monitoraggio sul telefono di qualcuno, report di fine anno dal commercialista. I dati esistono. Sono solo sparsi in sei posti diversi, arrivano troppo tardi per agire e non ti dicono mai cosa sta davvero succedendo a livello di parcella.
I tuoi dati esistono. Solo che non si parlano.
La resa in un foglio di calcolo. La finanza dal commercialista. La pressione delle malattie in un quaderno. Ogni decisione nasce da un quadro parziale costruito a mano. vinwAIve collega tutto.
Quando lo scopri, è già troppo tardi.
Il report di vendemmia arriva sei settimane dopo la raccolta. Le decisioni per la prossima stagione sono già in moto. vinwAIve ti dà lo stesso quadro in stagione, quando c'è ancora tempo per agire.
La media della tenuta nasconde la tua parcella peggiore.
Un numero complessivo accettabile può mascherare uno scarto di 50 punti di margine lordo tra la tua sezione migliore e la peggiore. Le medie di tenuta non rivelano i problemi. Li seppelliscono.
Non una dashboard. Un livello di intelligence che pensa per la tua tenuta.
La maggior parte dei software per il vigneto è uno specchietto retrovisore. vinwAIve è costruito perché ogni parcella, ogni nota di monitoraggio, ogni varietà e ogni euro alimentino una piattaforma di intelligence pensata per far emergere ciò che conta quando c'è ancora tempo per agire.
Intelligence predittiva
Chiedi cosa renderà questa annata in ricavi, resa e margine prima che accada. vinwAIve modella i risultati futuri a livello di parcella, non con medie di tenuta.
Insight preventivi
Classifiche a semaforo mostrano quali parcelle si stanno allontanando dagli obiettivi di resa o di costo quando c'è ancora tempo per agire. Segnalate in stagione, non sei settimane dopo la vendemmia.
AI conversazionale
Chiedi qualsiasi cosa. Quali parcelle devo prioritizzare? Cosa sta erodendo il margine del mio Chardonnay? Dove ho un deficit di SKU? Ottieni risposte, non solo dati.
Una piattaforma. Ogni ruolo al tavolo trova risposta alla propria domanda.
Le aziende vinicole comprano e decidono in modo collegiale. vinwAIve offre a ciascun decisore la vista che gli serve, attinta dagli stessi dati connessi della tenuta, così tutto il team lavora su un'unica versione della verità.
"Dove stiamo guadagnando e dove stiamo perdendo denaro nella tenuta?"
Ricavi, utile lordo e rischio a livello di portafoglio in un'unica vista, con la possibilità di scendere dalla tenuta alla singola parcella in pochi secondi.
"Dove sono i punti critici dell'azienda in questo momento, dal vigneto alle vendite e alla finanza?"
Classifiche a semaforo di ogni parcella rispetto agli obiettivi di resa e di costo, così le priorità della settimana si definiscono da sole.
"Dove stanno emergendo rischi di resa, malattie e problemi operativi?"
Monitoraggio, note di campo, maturazione delle uve e meteo in un unico flusso, ciascuno legato alla parcella, al tonnellaggio e al margine che interessa.
"Abbiamo le uve giuste, la qualità e i volumi per il nostro programma di vini?"
Offerta e domanda per SKU, tracciabilità dalla parcella all'etichetta e dati di maturazione, senza toccare i report di costo.
"Dove costi e margini si stanno discostando dal piano?"
Costo per tonnellata, ricavo per ettaro e margine lordo % per parcella ed etichetta, obiettivo contro consuntivo, aggiornati lungo tutta la stagione.
"Siamo in linea, dove è esposta l'azienda e dove sono le opportunità?"
Una lettura chiara della traiettoria dell'annata, del rischio di approvvigionamento, dei driver di margine e delle opportunità emergenti, con accesso in sola lettura per consiglieri e advisor.
Permessi basati sui ruoli integrati: un responsabile di vigneto può vedere i dati di parcella e di monitoraggio senza i dati finanziari aziendali, un enologo può vedere le allocazioni senza i report di costo, e consulenti o consiglieri hanno accesso in sola lettura. L'amministratore dell'account decide chi vede cosa.
Non vedrai solo di più. Deciderai meglio.
- Quali parcelle richiedono un intervento adesso e quali vanno lasciate stare?
- Dove rischiamo di mancare l'obiettivo di resa o di margine?
- Quali vigneti stanno trainando, o distruggendo, la redditività?
- Dove avremo surplus o carenze di uve per SKU?
- Quali parcelle meritano un euro in più di investimento e quali vanno riconsiderate?
- Cosa succede al profitto se cambiano resa, prezzo o qualità?
Vedi i problemi prima della vendemmia, non durante
Section Intelligence classifica ogni parcella con un semaforo rispetto ai suoi obiettivi di resa e di costo: in linea, 10% di scostamento, 15% o più. Quando una parcella inizia a deviare, la vedi con settimane di anticipo per agire, mappata e ordinata per impatto.
→ Classifica a semaforo di ogni parcella, in diretta per tutta la vendemmia
Il conto economico per parcella in stagione, non sei settimane dopo la vendemmia
Ricavo per ettaro, margine di utile lordo e costo per tonnellata a livello di parcella, obiettivo contro consuntivo, aggiornati lungo tutta la stagione. Non un numero di tenuta mediato. La performance reale di ogni parcella, quando può ancora influenzare le tue decisioni.
→ €/ha, €/tonnellata e margine lordo % per parcella, per tutta la vendemmia
Quali prodotti vinicoli ti stanno davvero facendo guadagnare
Traccia ogni parcella fino all'etichetta che alimenta. Vedi offerta e domanda per SKU in tonnellate ed equivalenti casse da 9 litri, con surplus e deficit segnalati per prodotto. Prendi decisioni di allocazione, reimpianto e prezzo partendo da dati di margine reali invece che da supposizioni.
→ Dalla vite alla bottiglia, con il margine collegato
Previsioni di resa sempre aggiornate senza ricostruire tutto
Campionamenti di resa rilevati in campo per parcella, per fase fenologica, consolidati in tempo reale su tutta la tenuta. Impegni di fornitura, programmi di cantina e logistica di vendemmia lavorano su dati correnti, non sui consuntivi dell'anno scorso e su una sensazione. L'avanzamento della raccolta confronta le uve trattenute e vendute con la stima man mano che arrivano.
→ Previsioni per parcella e tracciamento della raccolta, aggiornati per tutta la vendemmia
Ogni proprietà e ogni parcella, fianco a fianco
Gestisci più di una proprietà? vinwAIve ti offre un'unica vista su tutti i vigneti con dettaglio a livello di parcella su richiesta: raggruppa per proprietà, varietà, categoria o fascia di qualità e confronta fianco a fianco.
→ Qualsiasi proprietà, qualsiasi parcella, fianco a fianco
Chiedi qualsiasi cosa alla tua tenuta. Ottieni la risposta in pochi secondi.
Quali parcelle sono sotto l'obiettivo di resa? Dove ho un deficit di SKU? Parlami della parcella KA-PN03. Risposte in linguaggio naturale fondate sui dati reali della tua tenuta. Niente tabelle pivot. Niente ricostruzioni di tre ore.
→ Linguaggio naturale su tutto il dataset della tua tenuta
Cosa succede tra i filari, non solo in contabilità.
vinwAIve ora gestisce le operazioni di vigneto accanto ai tuoi dati finanziari, così monitoraggio, note di campo, maturazione e meteo vivono nella stessa piattaforma dei tuoi margini, e l'AI ragiona su tutto insieme.
Monitoraggio di parassiti e malattie
Osservazioni di monitoraggio strutturate su malattie, parassiti, insetti utili e fisiopatie. Filtra per vigneto, varietà, fascia di qualità o parcella, con un flusso di bozza e pubblicazione che tutto il team può usare dal campo.
Osservazioni di campo
Un flusso in tempo reale di note inviate dal vigneto, ciascuna classificata come Positiva, Attenzione o Allerta e legata a una parcella. Tocca il codice di una parcella e si aprono accanto il dettaglio completo, lo storico e i dati finanziari.
Maturazione delle uve
Campionamenti di maturazione per parcella seguiti lungo la curva di maturazione, accanto alla stima di resa e al conto economico della stessa parcella, così le decisioni di raccolta bilanciano aromi, tonnellaggio e margine.
Meteo e clima
Flussi in tempo reale dalle stazioni meteo per proprietà, previsioni di zona e dati stagionali integrati nella piattaforma. Le integrazioni per umidità del suolo e irrigazione sono le prossime in roadmap.
Section intelligence
Ogni osservazione, campione ed euro confluisce in una classifica a semaforo delle tue parcelle per resa e costo rispetto all'obiettivo, così le priorità della giornata si definiscono da sole.
Un solo cervello su tutto
Poiché operazioni e finanza condividono una sola piattaforma, l'AI può collegare una segnalazione di malattia a un rischio di resa e all'impatto sul margine dell'etichetta alimentata da quella parcella.
Conosci la conseguenza finanziaria prima di prendere la decisione
Cosa succede all'utile lordo se la resa cala del 10%? Se sposti una parcella a una fascia di qualità superiore? Se il mercato paga il 5% in meno? Scenarios ti permette di muovere le leve di offerta e domanda e vedere l'impatto su tonnellate, ricavi, OpEx e utile lordo ricalcolato in tempo reale rispetto alla baseline dell'annata corrente.
→ Leve di offerta e domanda, impatto sull'utile lordo in tempo reale rispetto alla tua baseline
Gestisci questa annata. Pianifica la prossima. Confronta le ultime tre.
vinwAIve gestisce l'intero ciclo di vita dell'annata: fai avanzare l'annata corrente attraverso le sue fasi, chiudila con una traccia di controllo pulita e promuovi la successiva, mentre Vintage Comparison mette fianco a fianco rese, tonnellate e obiettivi anno su anno. Ogni obiettivo che imposti è confrontato con quanto la stessa parcella ha realmente prodotto in passato, così il piano della prossima stagione si costruisce su evidenze e non sull'ottimismo.
→ Ciclo di vita dell'annata, confronto anno su anno, obiettivi con memoria
Non un chatbot aggiunto per forza. Un analista che ragiona su tutta la tua tenuta.
È questo che cambia le regole del gioco. L'AI di vinwAIve collega resa, operazioni, costi, allocazioni e performance finanziaria in un unico modello vivo della tua tenuta, poi ragiona su tutto insieme. Le domande che prima richiedevano tre giorni di lavoro di un analista e una pila di fogli di calcolo ora richiedono una frase e pochi secondi.
"Quali parcelle sono sotto il loro obiettivo di resa in questo momento, e quali rischiano di mancare il margine lordo?"
"Dove ho un deficit di offerta rispetto alla domanda, e quali prodotti vinicoli sono più esposti?"
"Riassumi l'utile lordo per vigneto e dimmi quale proprietà sta trascinando in basso il margine della tenuta."
"Quali parcelle stanno abbassando il margine lordo combinato della mia etichetta riserva? Cosa succede se tolgo la più debole?"
"Mostrami tutte le osservazioni in Allerta delle ultime due settimane e l'andamento della resa in quelle parcelle."
"Sulla base di questa annata, in quali parcelle dovrei aumentare gli investimenti l'anno prossimo, e quali dovrei riconsiderare?"
Personalizzabile per la tua azienda. Non adattare la tua reportistica ai vincoli dei database tradizionali. Chiedi a vinwAIve di riportare gli aspetti che contano di più per te.
Adottare qualcosa di nuovo dovrebbe ridurre il tuo rischio, non aumentarlo.
vinwAIve è progettato per dimostrare il suo valore sui tuoi dati e per posizionarsi sopra i sistemi di cui già ti fidi, invece di sostituirli.
Provalo sui tuoi dati
Vedi esattamente cosa significa la visibilità a livello di parcella per la tua realtà, con una dimostrazione guidata sui tuoi dati di resa e finanziari, prima di qualsiasi impegno.
Niente da smantellare e sostituire
vinwAIve collega i tuoi sistemi di produzione, contabilità, conformità e magazzino, e importa i tuoi fogli di calcolo. Il livello di intelligence si posiziona sopra ciò che già usi.
Operativo in una sola sessione di onboarding
Nessun progetto IT e nessuna migrazione di dati. Mappiamo la struttura della tua tenuta e colleghiamo i tuoi sistemi, così la maggior parte delle tenute è operativa in una sola sessione.
vinwAIve si posiziona al centro dei sistemi che già usi.
Niente da smantellare e sostituire. vinwAIve collega i sistemi di produzione, contabilità, conformità e magazzino che la tua tenuta già usa e importa i tuoi fogli di calcolo esistenti, così il livello di intelligence si posiziona sopra tutto.
Ogni numero che la tua tenuta genera. Finalmente connesso.
Performance Finanziaria
- Ricavi totali dei vini rispetto all'obiettivo
- OpEx del vigneto e costo per ettaro
- Ricavo per ettaro per parcella e vigneto
- Margine di utile lordo %, a livello di parcella e di tenuta
- Costo per tonnellata: scostamento obiettivo contro consuntivo
- Traiettoria del margine lordo % in stagione contro fine annata
Intelligence sulla Resa
- Resa totale della tenuta: obiettivo contro previsione corrente
- Campionamenti rilevati in campo per parcella, per fase fenologica
- Dettaglio delle rese per varietà
- Tonnellate per ettaro: obiettivo contro previsione contro finale
- Avanzamento della raccolta: trattenuto contro venduto, in tempo reale
- Benchmark storico delle rese per parcella
Intelligence Operativa
- Osservazioni di monitoraggio di parassiti e malattie
- Note di campo: Positiva / Attenzione / Allerta per parcella
- Campionamenti di maturazione delle uve per parcella
- Stazioni meteo in tempo reale e previsioni di zona
- Classifiche a semaforo delle parcelle, resa e costo
- Dati viticoli stagionali e regionali
Prodotti Vinicoli e Allocazione
- Mappatura delle allocazioni da parcella a etichetta
- Margine lordo % e ricavo per ettaro per prodotto vinicolo
- Offerta contro domanda per SKU: tonnellate e casse 9LE
- Surplus e deficit segnalati per prodotto
- Contributo multi-prodotto all'utile lordo della tenuta
- Consolidamenti per categoria e fascia di qualità
Scenari e Pianificazione delle Annate
- Leve what-if: resa, qualità, prezzo, costo, mix
- Impatto sull'utile lordo in tempo reale rispetto alla baseline dell'annata corrente
- Confronto delle annate anno su anno
- Ciclo di vita dell'annata: fase, chiusura, promozione
- Obiettivi della prossima annata costruiti sui consuntivi
- Sintesi progressiva degli scostamenti su tutta la tenuta
Insight Basati sull'AI
- Segnali a semaforo: parcelle che si allontanano dall'obiettivo
- Previsioni predittive di ricavi e margine dell'annata
- Analisi delle cause di ogni scostamento
- Identificazione delle parcelle sovraperformanti
- Raccomandazioni di allocazione da dati in tempo reale
- Domande e risposte in linguaggio naturale su tutta la tenuta
Ancora fogli di calcolo e un report di vendemmia vecchio di sei settimane?
| Funzionalità | vinwAIve | Fogli di calcolo | Software agricolo generico | Strumenti tradizionali per il vigneto |
|---|---|---|---|---|
| Performance finanziaria a livello di parcella | Sì, in tempo reale | Manuale, soggetta a errori | Non disponibile | Parziale / a fine stagione |
| Monitoraggio a semaforo obiettivo contro consuntivo | Sì, in stagione | Solo aggiornamenti manuali | A volte | A volte |
| Monitoraggio di parassiti e malattie con contesto finanziario | Sì | No | Solo monitoraggio | Solo monitoraggio |
| Modellazione di scenari what-if sull'utile lordo | Sì, ricalcolo in tempo reale | No | No | No |
| Confronto delle annate anno su anno | Sì | Con fatica | No | Variabile |
| Tracciabilità dal prodotto vinicolo alla parcella | Sì | No | No | Raramente |
| Margine lordo % per parcella, per etichetta | Sì | No | No | No |
| Previsione predittiva dei ricavi dell'annata | Sì | No | No | No |
| Interrogazione AI in linguaggio naturale | Sì | No | No | No |
| Flussi meteo e climatici per proprietà | Sì | No | A volte | Variabile |
| Vista di portafoglio multi-vigneto | Sì | Con fatica | A volte | Variabile |
| Costruito specificamente per le tenute vinicole premium | Sì | Generico | Generico | A volte |
I tuoi dati esistono già. Noi ci colleghiamo.
Nessun progetto IT. Nessuna migrazione di dati. Nessuna partenza da zero. vinwAIve collega i sistemi che la tua tenuta già usa, importa i dati che già produce e ti rende operativo in una sola sessione di onboarding.
Importazione da fogli di calcolo
Carica i tuoi file di resa esistenti, i dati delle parcelle e i registri finanziari. vinwAIve li elabora automaticamente, senza bisogno di riformattare. La maggior parte delle tenute è operativa in una sola sessione di onboarding.
Connessioni ai sistemi
Collega il tuo database di produzione, il software di contabilità, i portali di conformità e i sistemi di magazzino, così tutto ciò che serve al tuo team sta dietro un solo login, con importazioni di dati che mantengono il quadro aggiornato per tutta la stagione.
Onboarding guidato
Non ti serve un team IT. Il nostro onboarding mappa la struttura della tua tenuta, le parcelle, le varietà e i prodotti vinicoli nella piattaforma. Noi ci occupiamo della configurazione. Tu ottieni la visibilità, di solito già nella prima sessione.
Tutto quello che devi sapere
Che cos'è vinwAIve?
A chi si rivolge vinwAIve?
In cosa vinwAIve è diverso dagli altri software di gestione del vigneto?
Cosa fa il monitoraggio di parassiti e malattie?
Che cos'è la modellazione di scenari in vinwAIve?
vinwAIve può confrontare le annate?
Quali dati collega e analizza vinwAIve?
vinwAIve può gestire più vigneti?
Come funziona l'AI in vinwAIve?
Che cos'è l'analisi del vigneto a livello di parcella?
Usiamo già un sistema di produzione di cantina. vinwAIve lo sostituisce?
vinwAIve include i dati meteo?
E se i nostri dati sono disordinati o incompleti?
I dati del nostro vigneto sono sicuri e privati?
Possiamo controllare chi ha accesso a quali dati all'interno della piattaforma?
Scopri dove la tua tenuta sta lasciando margine nel vigneto.
Esplora la piattaforma con i dati della tua tenuta e vedi esattamente cosa significa la visibilità a livello di parcella per la tua realtà, prima che la prossima annata sia già in moto.